


Bear Steepener Looms As Window For Volatility Opens

A few thousand of you read my free daily market commentary as part of the Substack community. If you enjoy the daily free content, I encourage you to explore my paid membership area. In this area, I provide deeper daily insights, including a detailed video and a transcript edited by ChatGPT for clarity and readability, along with a glossary of terms discussed in the video. Additionally, I offer a daily written commentary that covers many of the topics introduced in my free blogs and premium articles in greater depth.
Below, I have included a free sample of a member area commentary and video from May 20. I hope you enjoy your Memorial Day weekend and the kick-off to the summer season.
-Mike
NOTES and Highlights
5/20/25 - VIX Opex tomorrow could loosen up the S&P 500 to move more freely, while bullish options positioning could lead to a break of support at 5,900 and a gap fill around 5660 in the following days.
5/19/25 - The S&P 500 still has significant levels of gamma built at 5,950 and then 6,000, which serve as resistance for now. Additionally, the VIX opex is on Wednesday. If implied volatility and options positions have largely been responsible for the rise in the market, then the effects of that should have disappeared entirely by Wednesday.
5/16/25- May OPEX allows an opportunity for the market to go lower; if not, a new all-time high will probably be next if it doesn't. It should become clearer after VIX OPEX on Wednesday.
5/15/25- Today is the QYLD ETF buyback of the NDX covered call at 18,200. That could have an impact on price action.
5/14/25- VIX and VVIX could be bottoming, and are now starting to move higher. Additionally, delta exposures in the S&P 500 are very lopsided to calls, and OPEX this week creates a window for a pullback. Additionally, the 30-year rate is now pushing the 5% level, which is interesting, given that is where Trump paused tariffs. If rates keep rising, stocks will have a problem.
Charts via TradingView, Optioncharts, and LSEG
VIDEO
Write-up
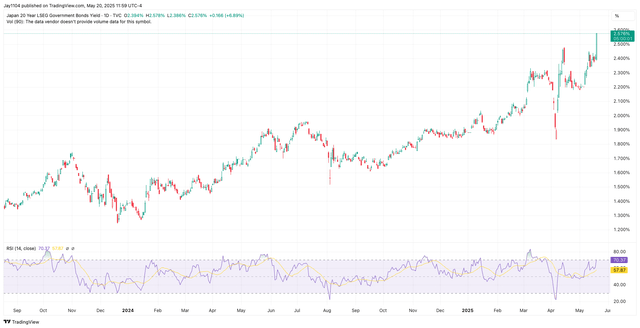
Rates in Japan surged overnight following a weak 20-year bond auction, pushing the 20-Year JGB yield up by 17 bps and lifting the entire yield curve higher. This move will clearly affect U.S. rates as the spread between U.S. and Japanese yields narrows. It also provides additional justification for today’s rise in U.S. 30-year Treasury rates.
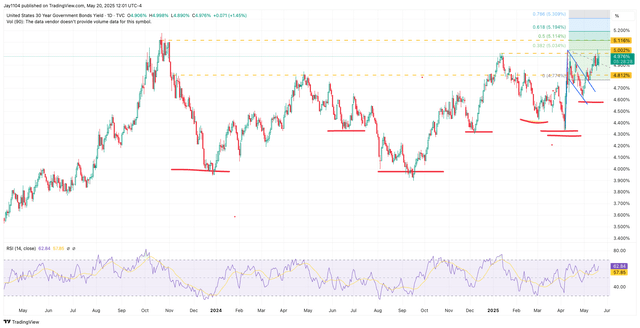
The 30-year yield is testing the 5% level again. At this point, it seems only a matter of time before it breaks through resistance and moves toward the 2023 highs near 5.12%. Everything—from the Fed’s rising “neutral” rate and the ballooning deficit and debt, to Moody’s downgrade and climbing global yields—points to higher rates ahead.
The biggest question is whether—and when—the BOJ steps in to stabilize the JGB market, and that isn’t easy to answer. Unless the BOJ plans to restart QE, it’s unclear how they’ll regain control, especially since they currently appear to be on hold regarding interest rate hikes.
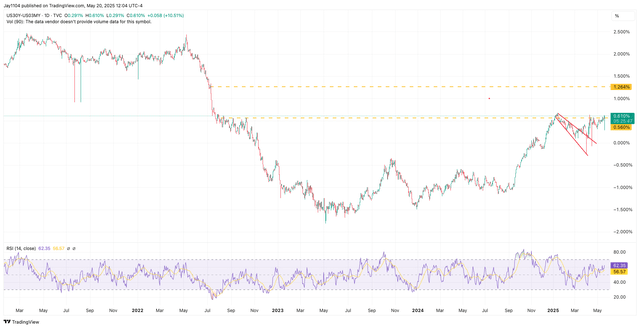
Meanwhile, the 30-year minus 3-month Treasury spread is once again nearing a critical breakout point at 60 bps. If it breaks through, a rapid steepening toward 1.25% seems likely.
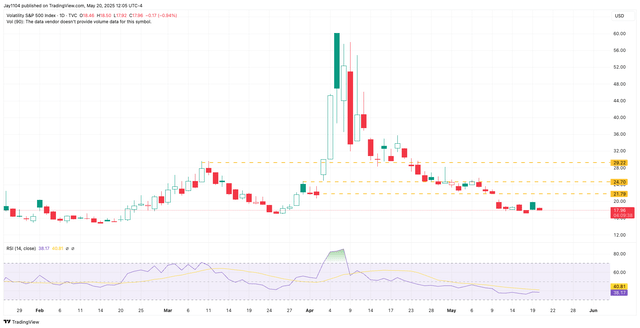
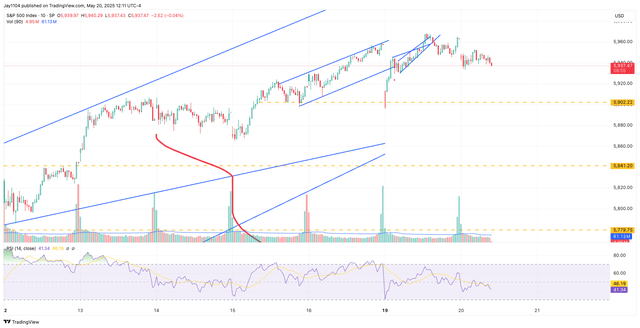
Stocks are trading down roughly 30 bps today. With VIX options expiration tomorrow, the VIX seems stuck around 18, which isn’t helping lift the S&P 500 today as it did yesterday.
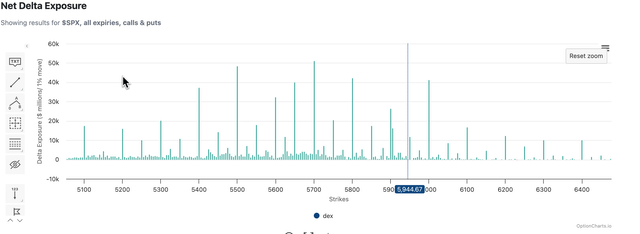
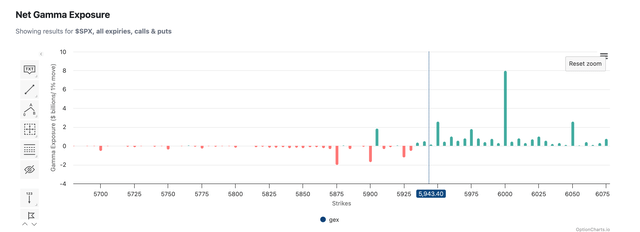
For now, the market continues to carry plenty of positive delta, and that hasn’t changed yet, meaning the setup from Friday remains intact. More importantly, we’re approaching the zero-gamma level—if gamma flips negative, volatility could start to rise sharply, accelerating any market decline as traders begin unwinding their positive delta positions.
I’d estimate that gamma likely flips negative somewhere around 5,930.
The technical patterns suggest a return to 5,900 in the near term, with potential for further declines if that support level breaks.
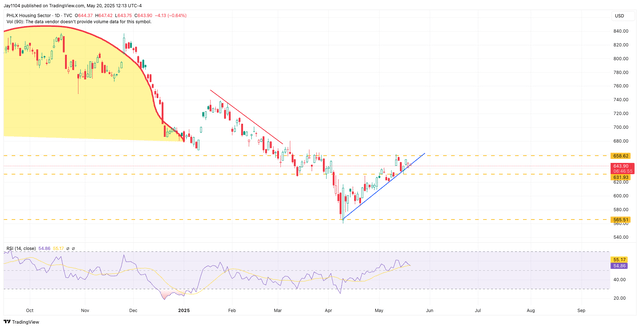
The HGX housing index is also very close to breaking its uptrend, and if U.S. rates continue rising, housing stocks will likely come under significant pressure.
Maybe it’s just coincidence, but the DXY has a similar pattern to the HGX, and it appears the dollar is also close to breaking its uptrend, potentially setting up a return toward recent lows.
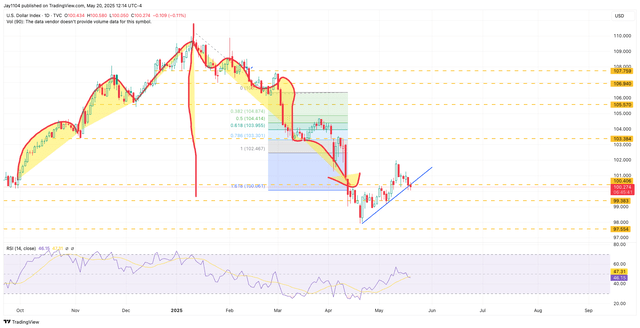
Rising long-end rates paired with a weaker dollar is a clear stagflation warning, and that’s ultimately negative for stocks in the longer run.
With VIX options expiration tomorrow, we should soon be free from all option-related flows. If the market is set to make a decisive move, the window of opportunity is now wide open.
-mIke
Transcript and Terms by Chatgpt
Zero-gamma level: The index price where options dealers’ gamma exposure switches from positive to negative, impacting market volatility and directional movement.
Bear steepening: A scenario where long-term interest rates rise faster than short-term rates, steepening the yield curve due to selling pressure in long-dated bonds.
Term premium: Extra compensation investors require for holding longer-term bonds instead of rolling over short-term debt, reflecting uncertainty over interest rate and inflation risks.
Neutral rate: The theoretical interest rate level that neither stimulates nor restricts economic growth.
Negative gamma: A condition where market makers must sell into declining markets and buy into rising markets, amplifying volatility.
Implied volatility (IV): Market expectation of future volatility, reflected in options prices.
Basis points (bps): One basis point equals 0.01%; a unit used to measure interest rate changes.
TLT: An ETF (exchange-traded fund) tracking long-duration U.S. Treasury bonds, sensitive to long-term interest rate movements.
Fed funds futures: Derivative contracts reflecting market expectations for future Federal Reserve interest rate policy.
JGB: Japanese Government Bond.
GEC (Gamma Exposure Chart): A graphical representation of options gamma exposure at various market levels.
Delta positioning: Market participants’ net directional exposure resulting from options positions; positive delta implies long positioning, negative delta implies short.
Last night, Japanese yields surged significantly following a weak 20-year auction. The entire yield curve rose sharply, with the 20-year up nearly 17 basis points and the 10-year reaching 1.5%. This upward pressure on Japanese rates is pushing U.S. rates higher as well. The U.S. 30-year Treasury yield tested 4.99% today and remains elevated near 4.98%.
The spread between the 30-year and 3-month U.S. Treasuries is back near a critical breakout at 60 basis points. A decisive move above 5% in the 30-year yield could trigger significant bear steepening, pushing yields even higher. The fundamental case for higher long-term rates is strong—higher neutral rates, persistent deficits, growing debt burdens, and rising global yields all point upward.
Globally, UK long-term rates are also moving notably higher, with the UK 30-year yield nearing 5.46% and the 10-year approaching key resistance at 4.70%. In contrast, China's rates remain low due to their economic struggles.
This global backdrop and rising U.S. term premiums suggest long-end rates will continue to climb unless a recession emerges. The market currently seems priced more for stagflation, given rising rates combined with a weakening dollar.
The dollar index (DXY) is close to breaking its uptrend, potentially signaling further weakness. Rising rates will also negatively impact housing, with the HGX housing index near critical support.
Wingstop has historically acted as a leading risk indicator and could provide early signals if it starts to decline sharply. Overall, there's a significant window now for increased volatility in the S&P 500, especially if we breach key support levels around 5,900. Any significant decline could quickly gain momentum due to negative gamma positioning.
We'll continue to monitor these developments closely and update you again tomorrow. Have a great rest of your day, and see you soon.
This report contains independent commentary to be used for informational and educational purposes only. Michael Kramer is a member and investment adviser representative with Mott Capital Management. Mr. Kramer is not affiliated with this company and does not serve on the board of any related company that issued this stock. All opinions and analyses presented by Michael Kramer in this analysis or market report are solely Michael Kramer’s views. Readers should not treat any opinion, viewpoint, or prediction expressed by Michael Kramer as a specific solicitation or recommendation to buy or sell a particular security or follow a particular strategy. Michael Kramer’s analyses are based upon information and independent research that he considers reliable, but neither Michael Kramer nor Mott Capital Management guarantees its completeness or accuracy, and it should not be relied upon as such. Michael Kramer is not under any obligation to update or correct any information presented in his analyses. Mr. Kramer’s statements, guidance, and opinions are subject to change without notice. Past performance is not indicative of future results. Neither Michael Kramer nor Mott Capital Management guarantees any specific outcome or profit. You should be aware of the real risk of loss in following any strategy or investment commentary presented in this analysis. Strategies or investments discussed may fluctuate in price or value. Investments or strategies mentioned in this analysis may not be suitable for you. This material does not consider your particular investment objectives, financial situation, or needs and is not intended as a recommendation appropriate for you. You must make an independent decision regarding investments or strategies in this analysis. Upon request, the advisor will provide a list of all recommendations made during the past twelve months. Before acting on information in this analysis, you should consider whether it is suitable for your circumstances and strongly consider seeking advice from your own financial or investment adviser to determine the suitability of any investment.