


Divergent Paths Could Be Trouble For The Stock Market


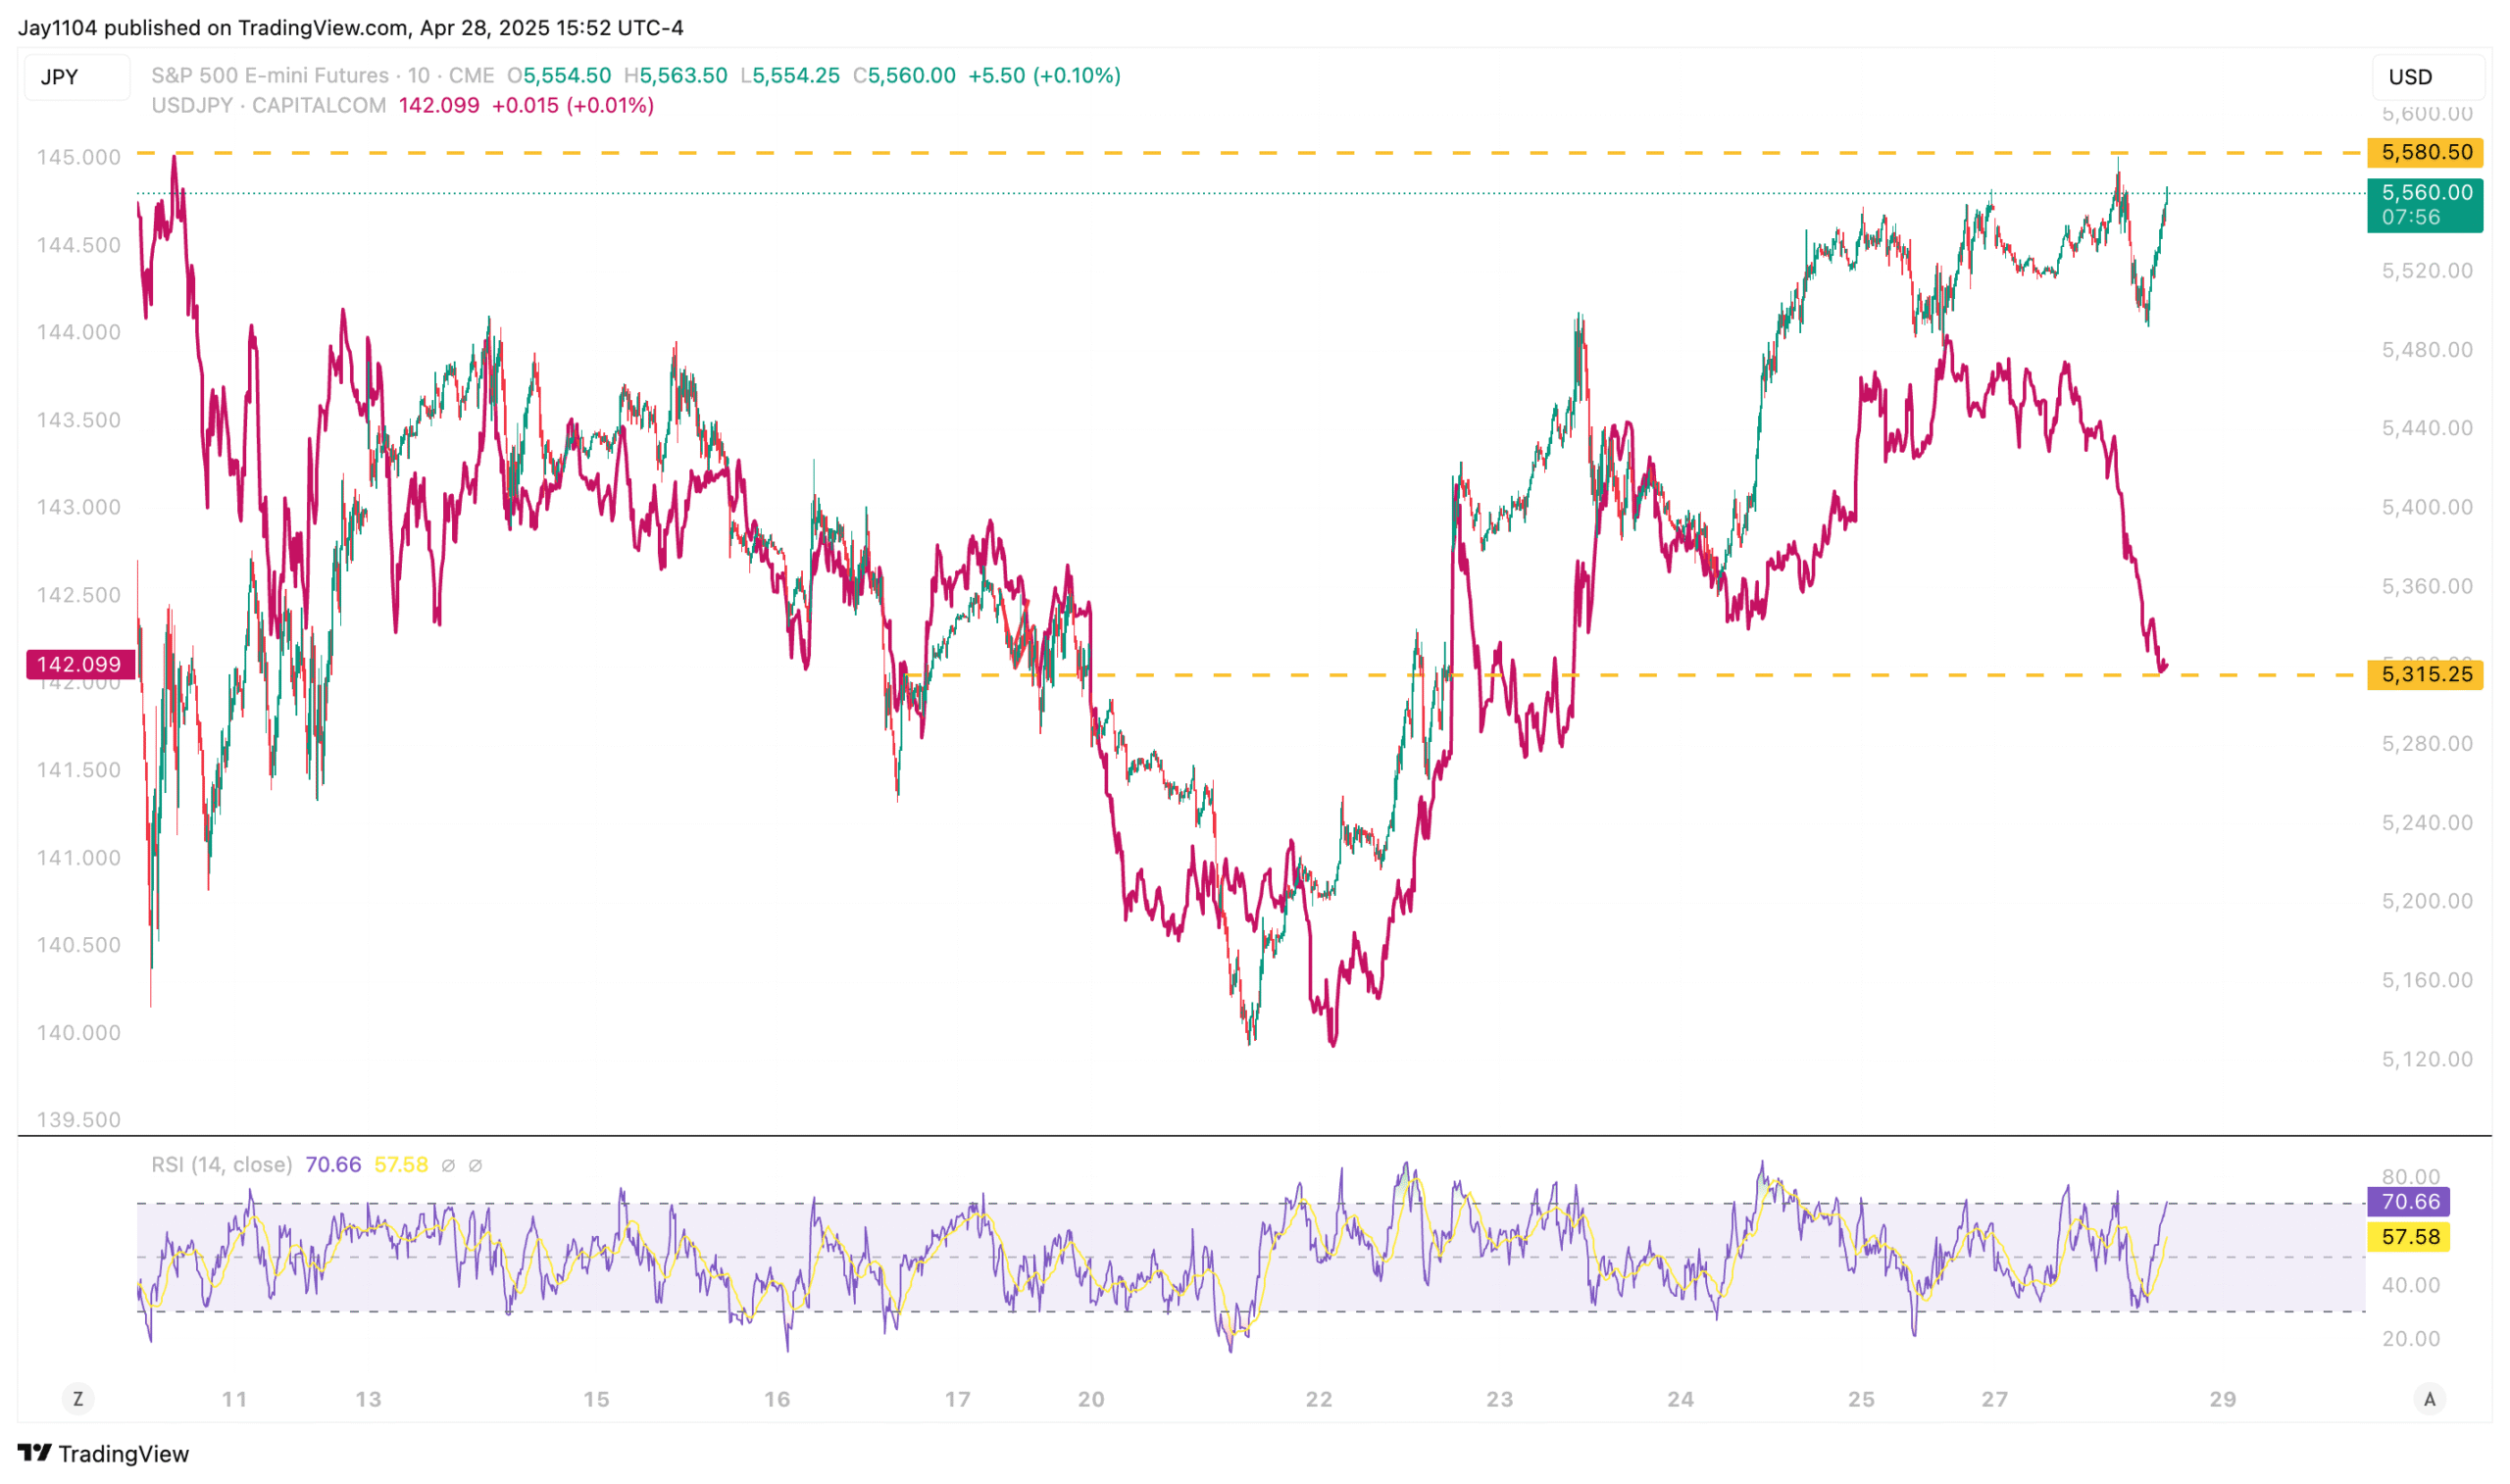
It was an interesting day in FX, with the yen strengthening by more than 1% against the dollar and the Swiss franc gaining 80 bps. Recently, we’ve grown accustomed to seeing stocks and bonds sell off amid dollar weakness, but today was different—stocks were essentially flat, and yields moved lower.
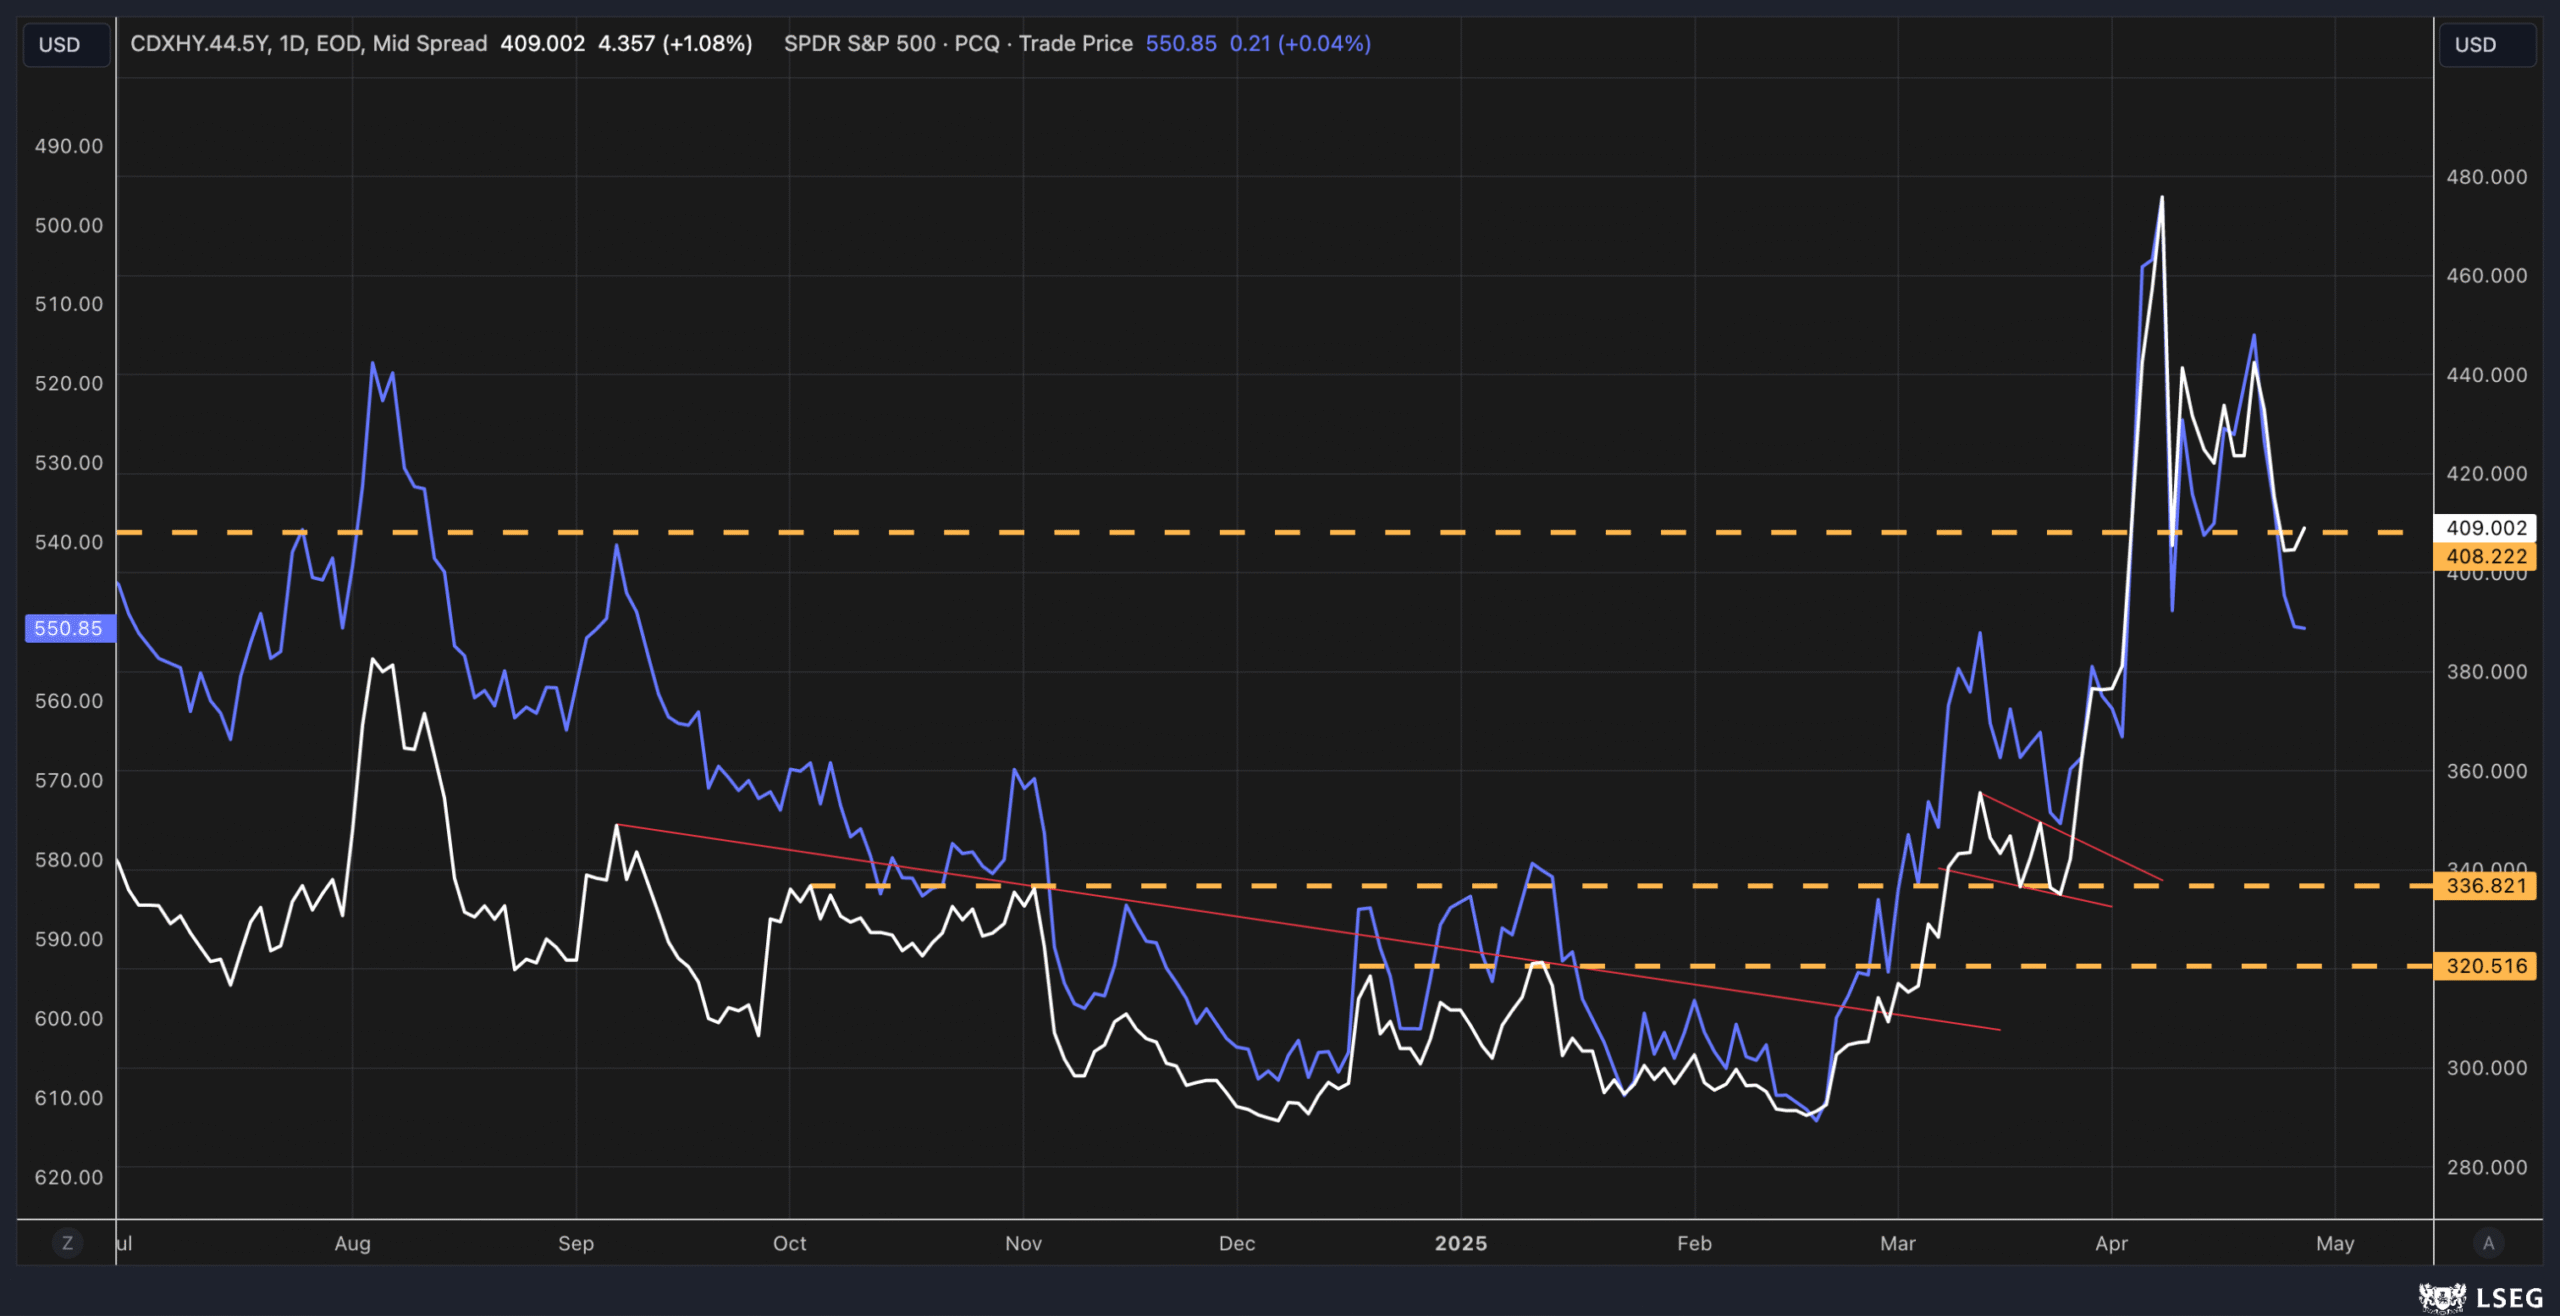
There’s also been a minor divergence between the S&P 500 and CDX HY credit spreads. In fact, over the past two days, credit spreads have widened slightly, while the S&P 500 has managed to rally (inverted).
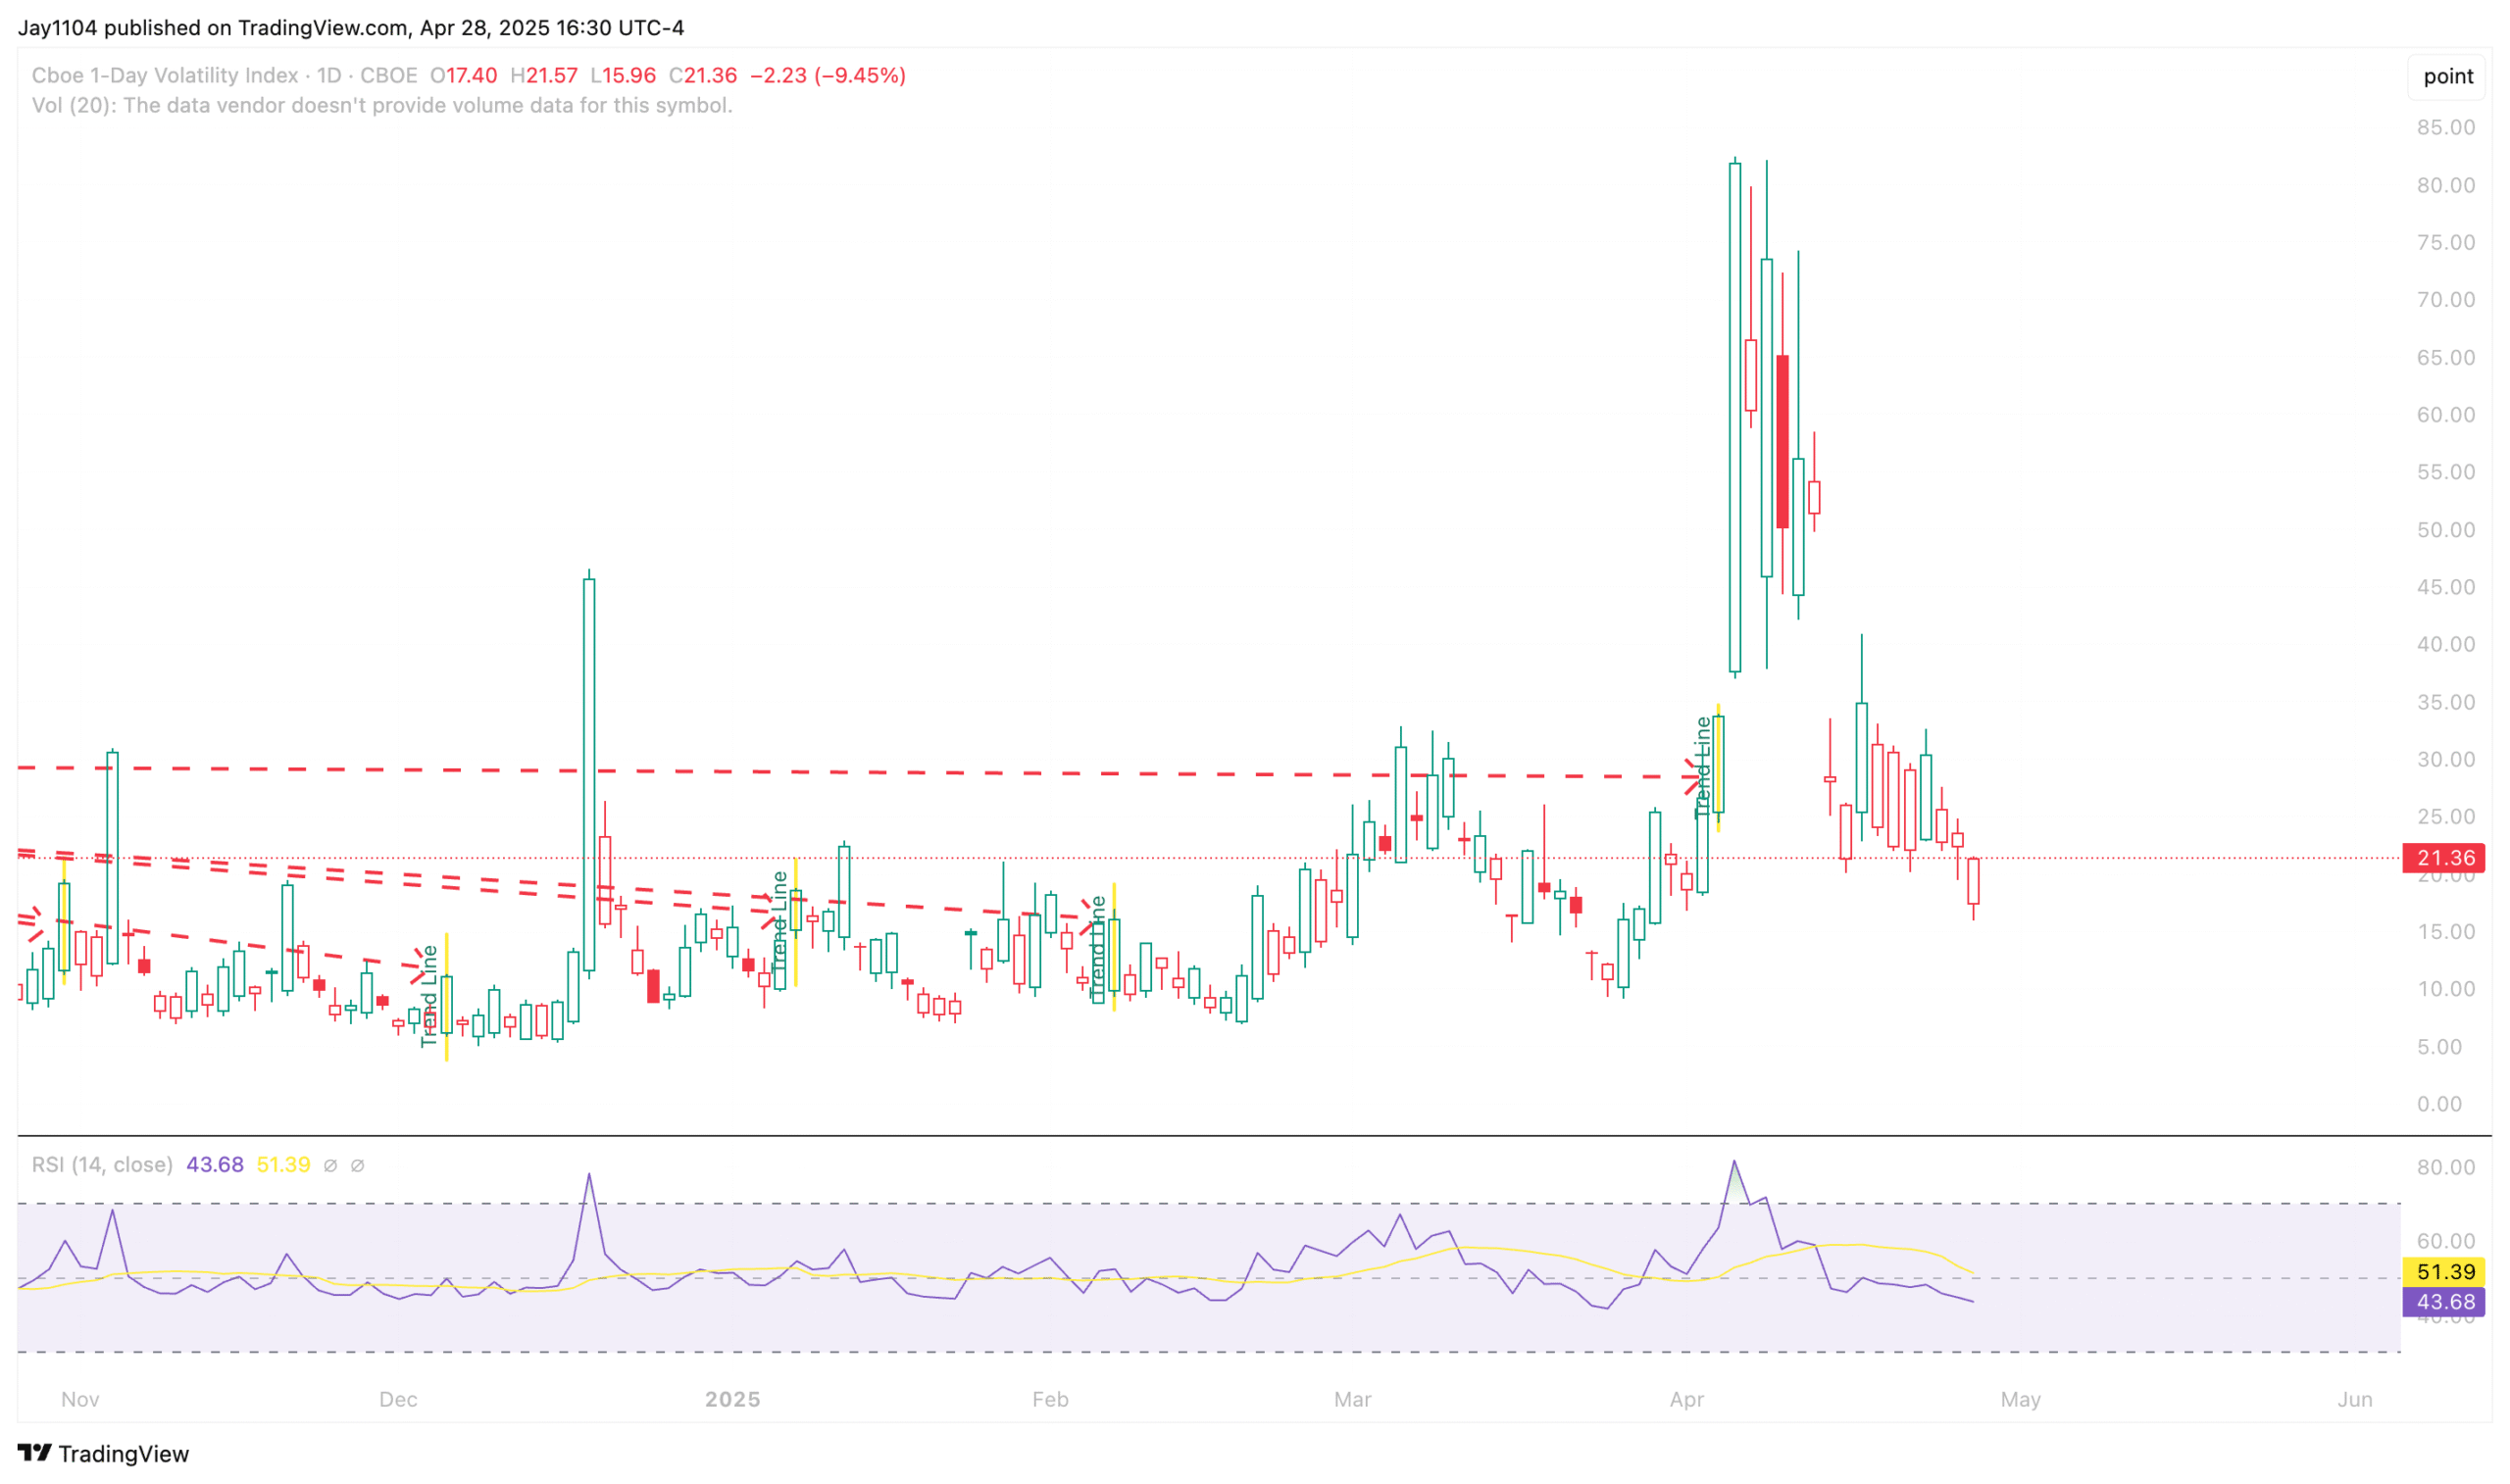
The VIX was higher today, rising to 25.2, not a big move, but overall, I would think that we will continue tosee implied volatility rise this week. Meanwhile, the VIX 1Day actually finished the day lower, and I would think that as the week goes on the VIX 1Day will continue to rise, most likely right into the Thursday close ahead of the Job report on Friday morning.
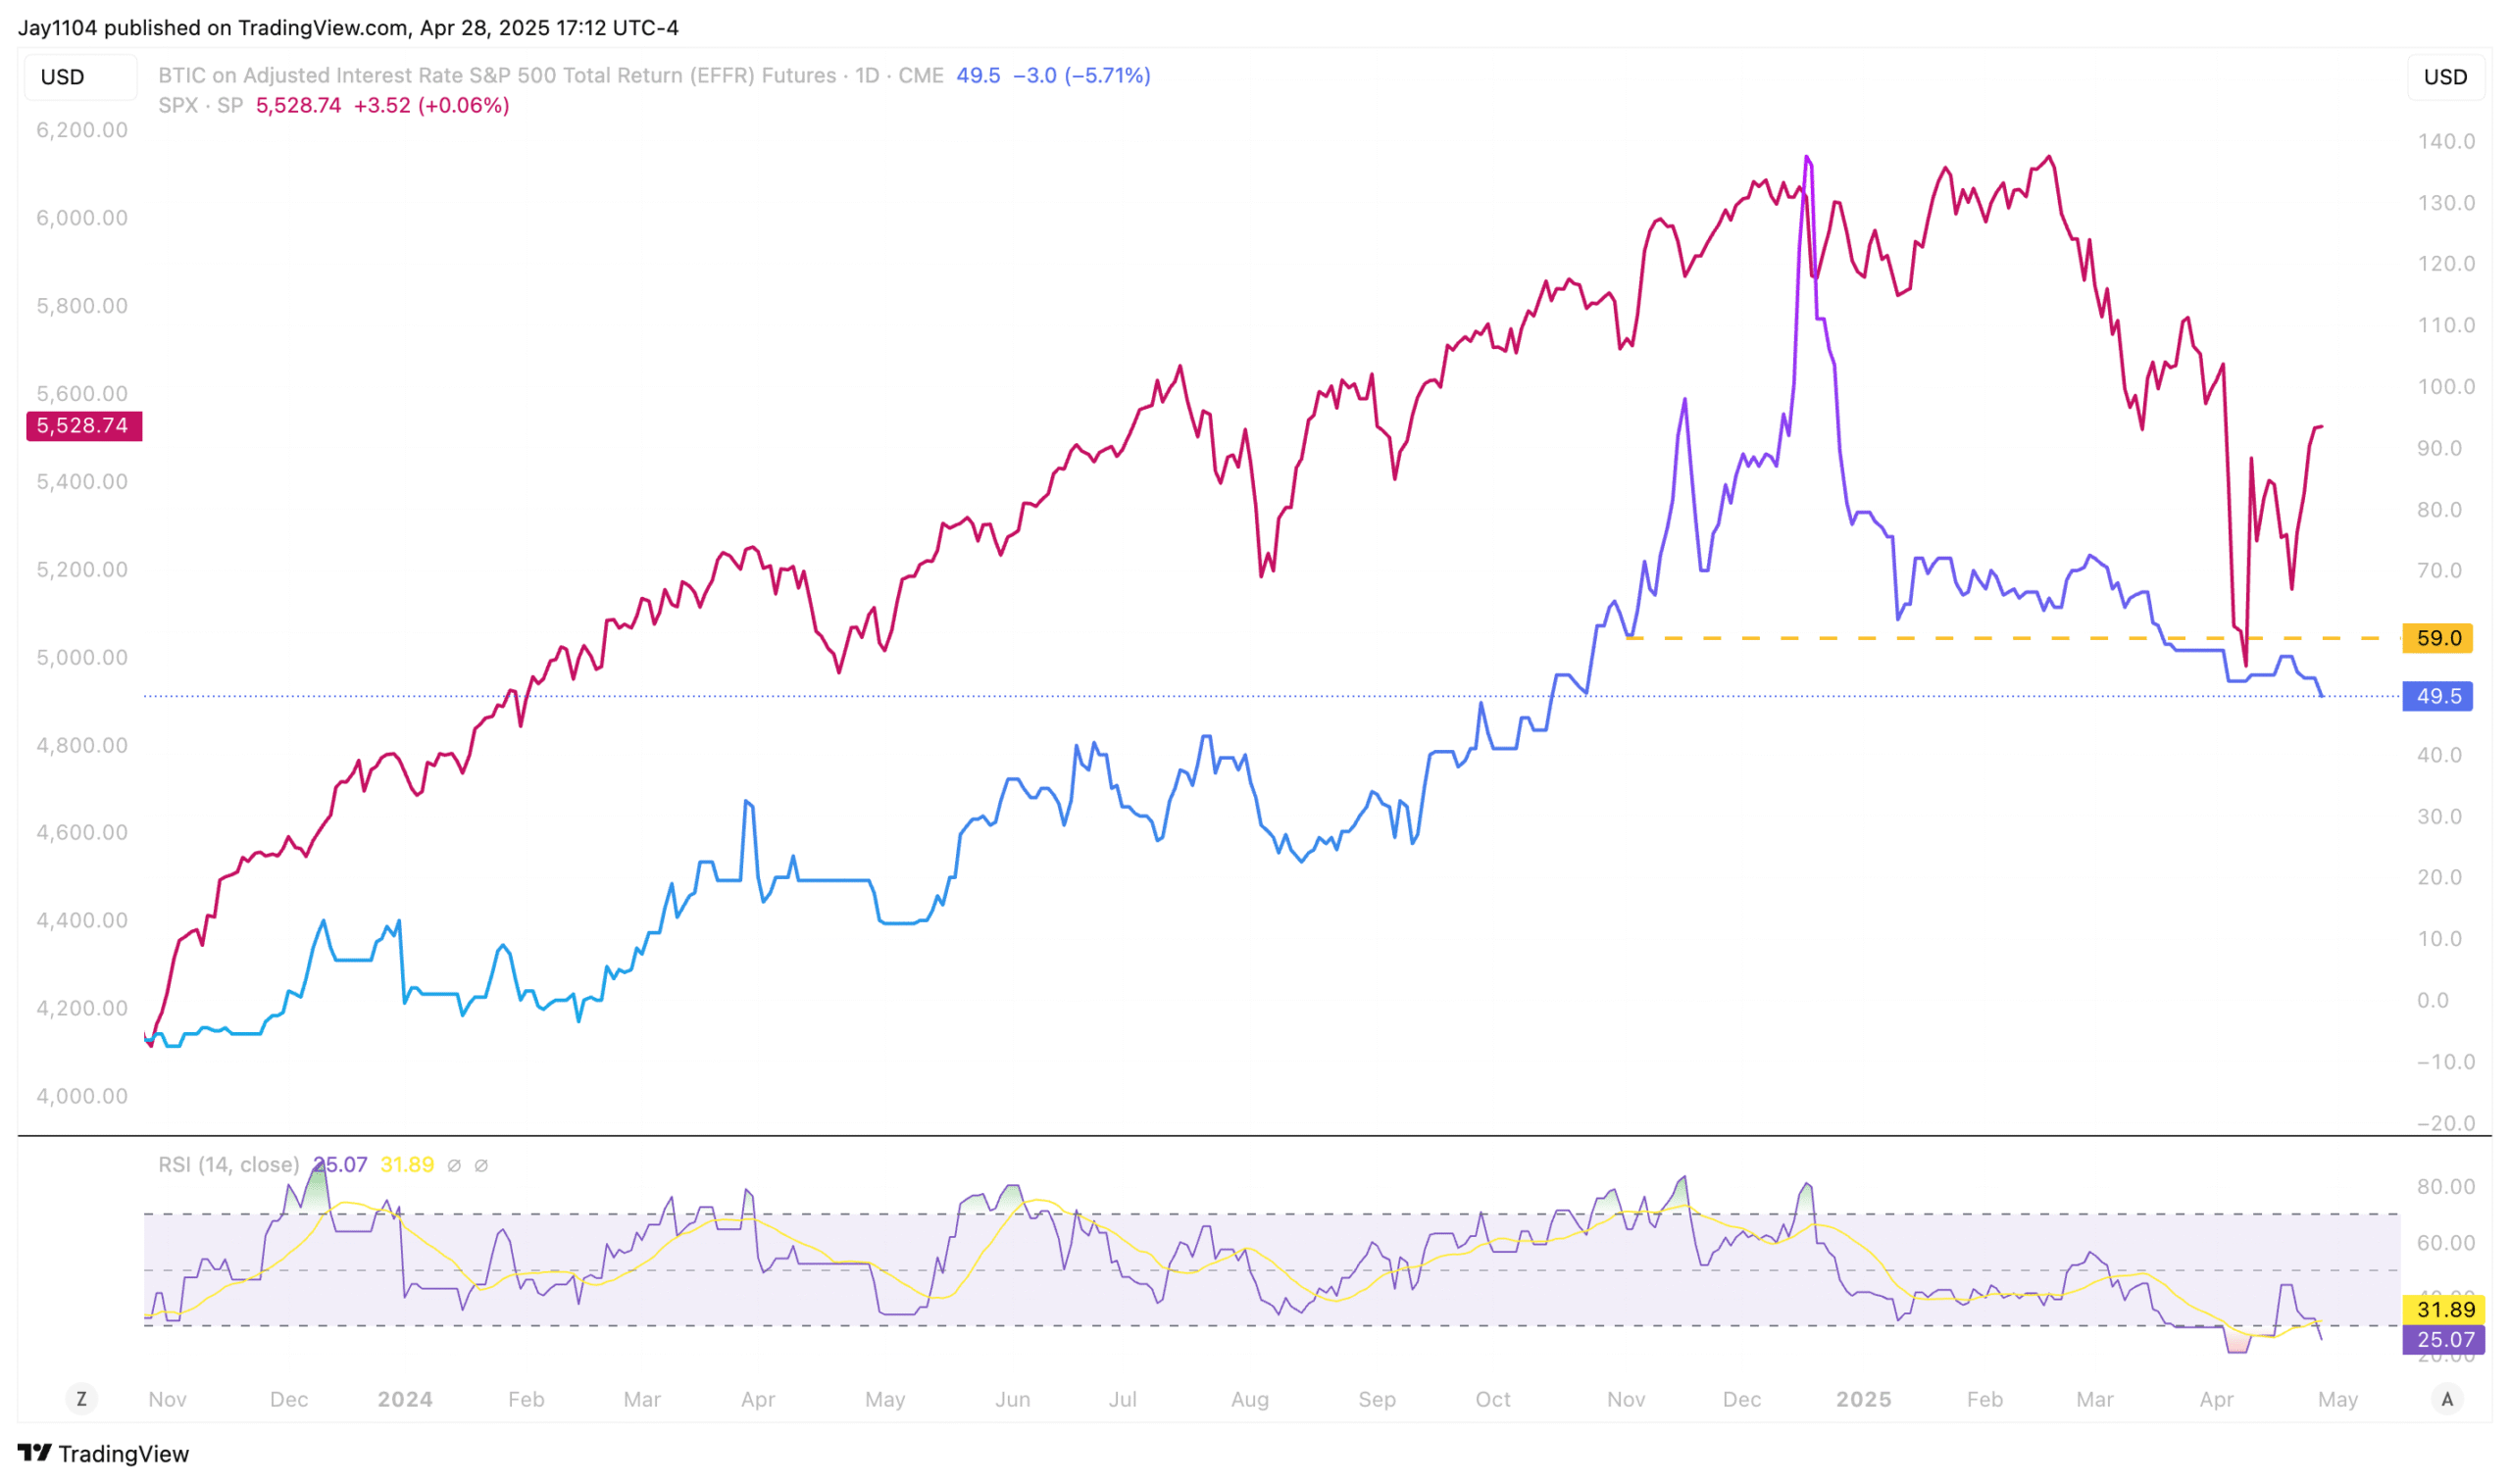
Equity financing costs continued to decline today, with the second-month futures contract dropping by 3 points to close at 49.5 bps, its lowest level since October.
I would say that a stronger yen, wider credit spreads, and lower equity financing costs are not bullish signals.
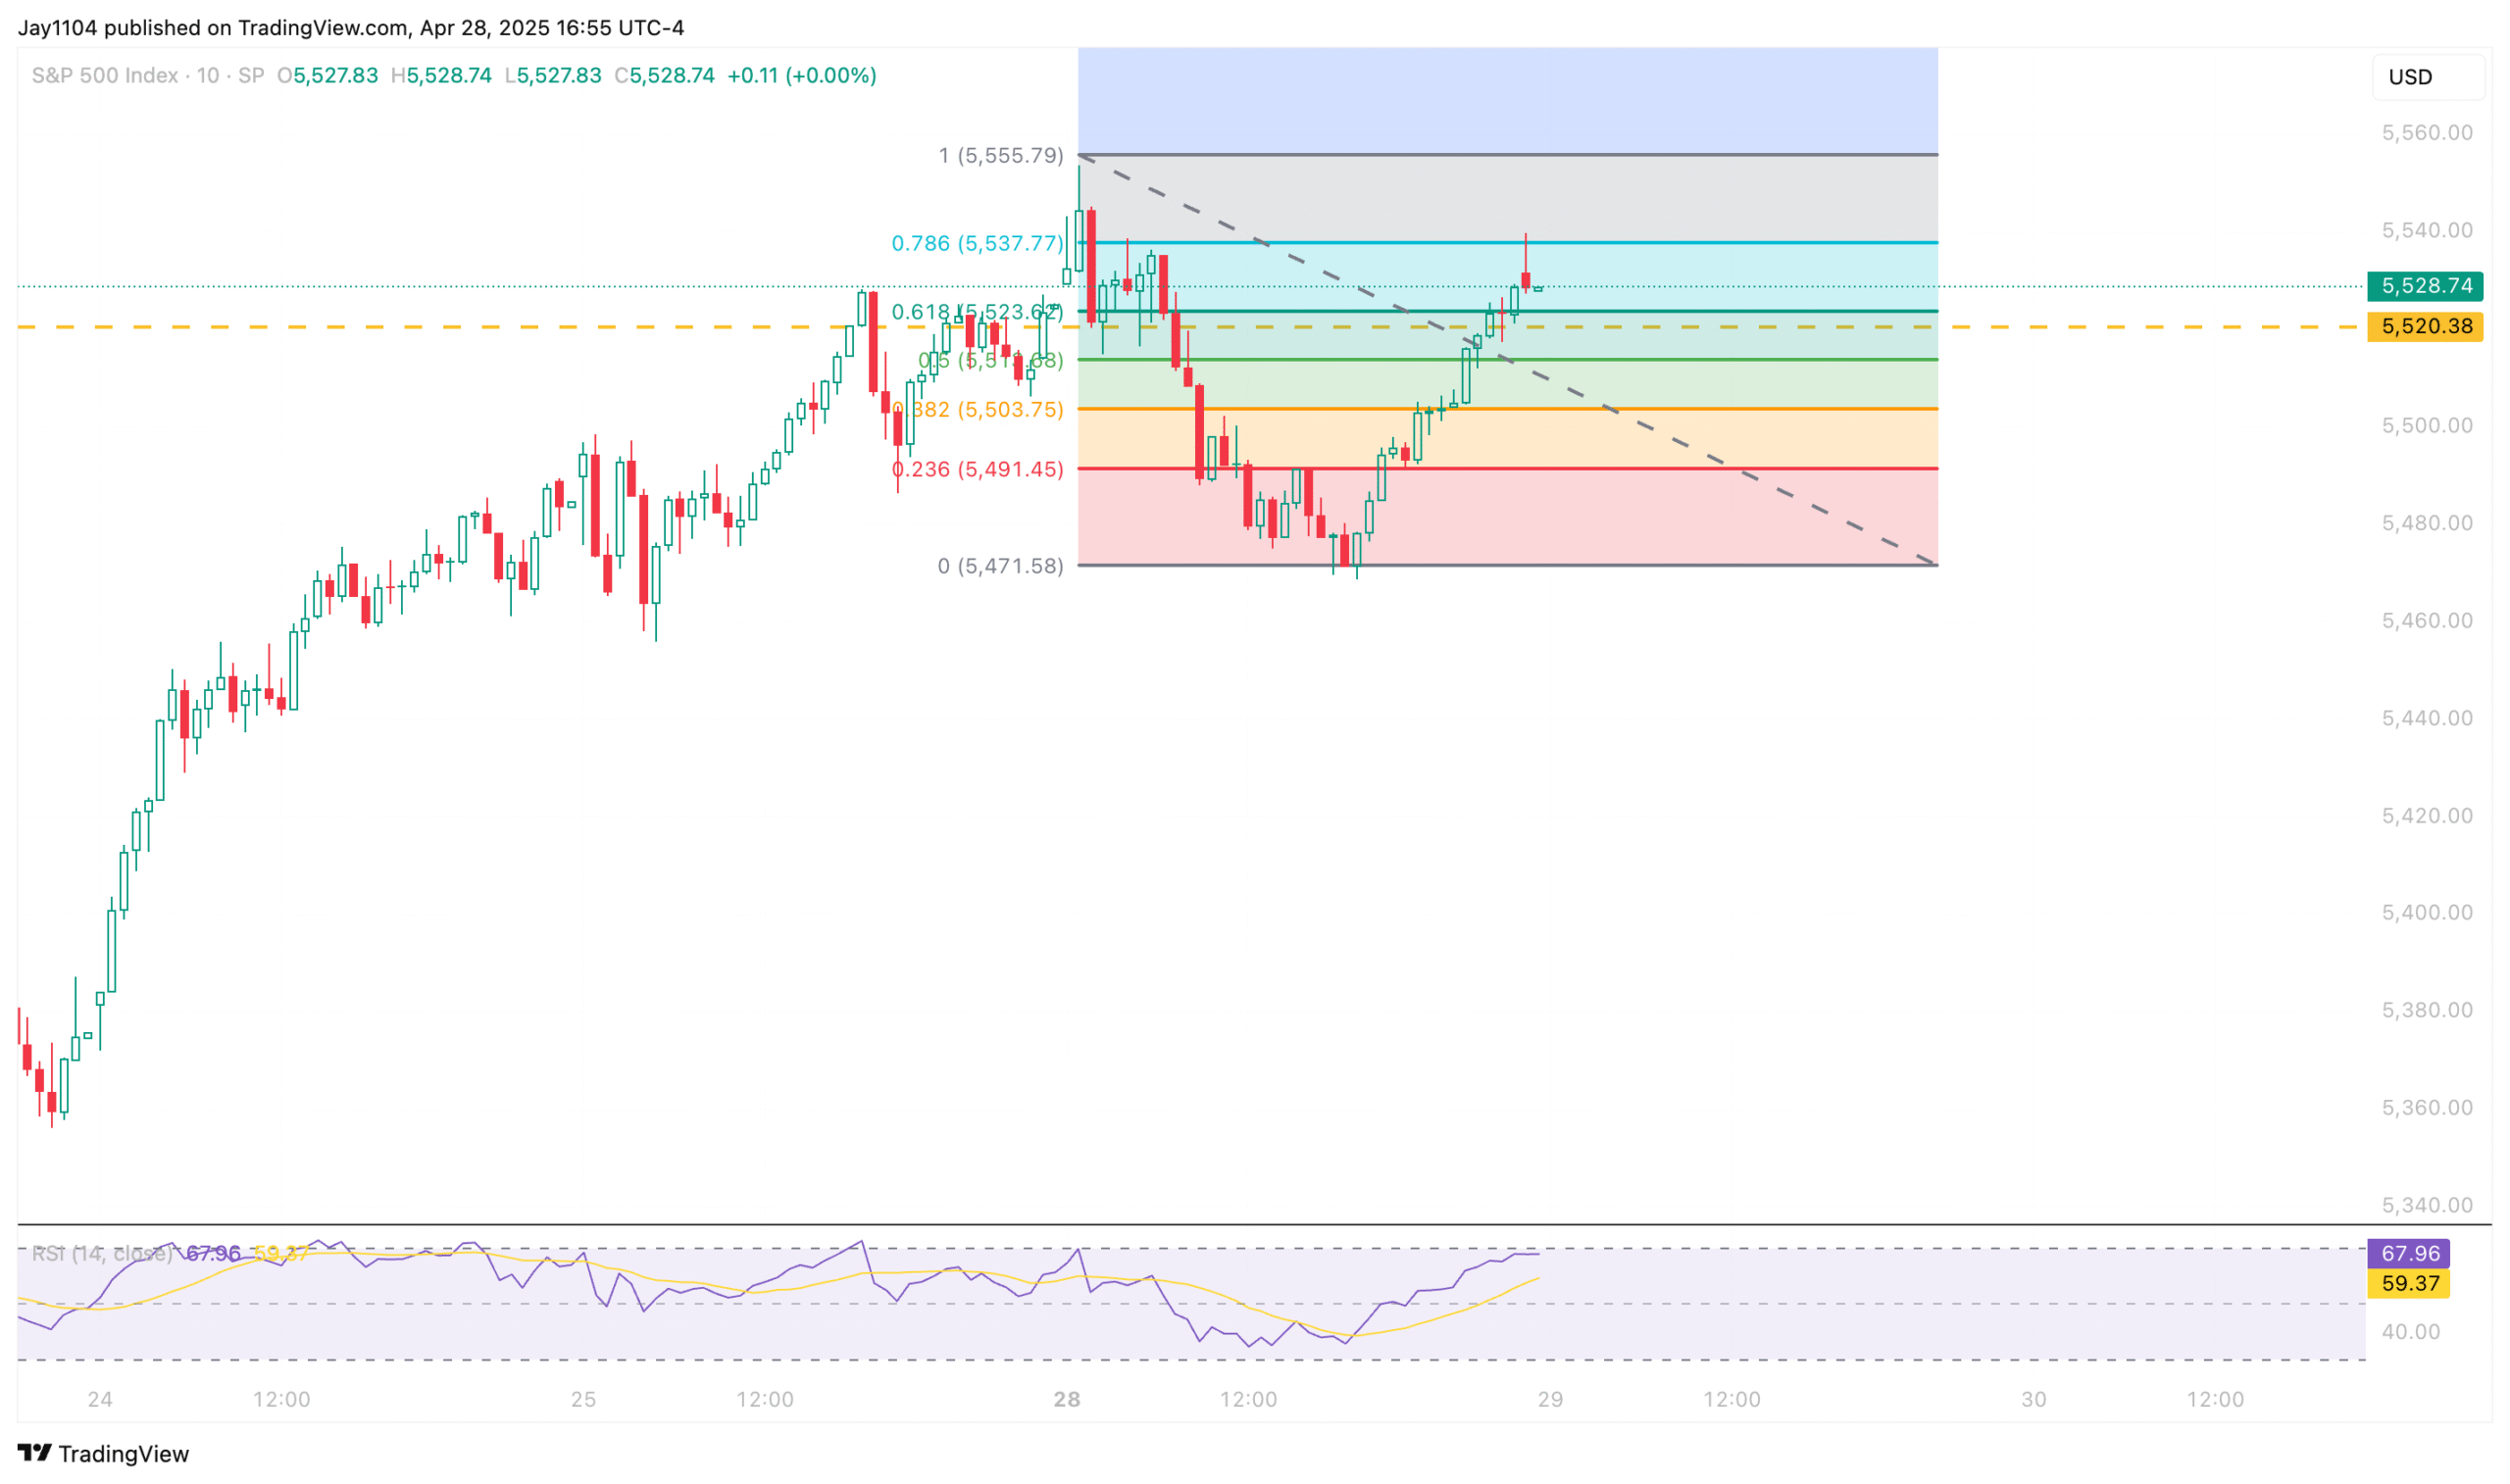
We have a situation where stocks have gone their own way somewhat. It doesn’t necessarily mean stocks are wrong, but it also doesn’t mean they’re right. I seriously doubt they can continue diverging from credit spreads, equity financing costs, and the yen for long, especially knowing that IV is likely to rise. It’s possible that today’s action was just part of a broader process of the stock market starting to reverse course. In fact, the index stopped rising today precisely at the 78% intraday retracement level.
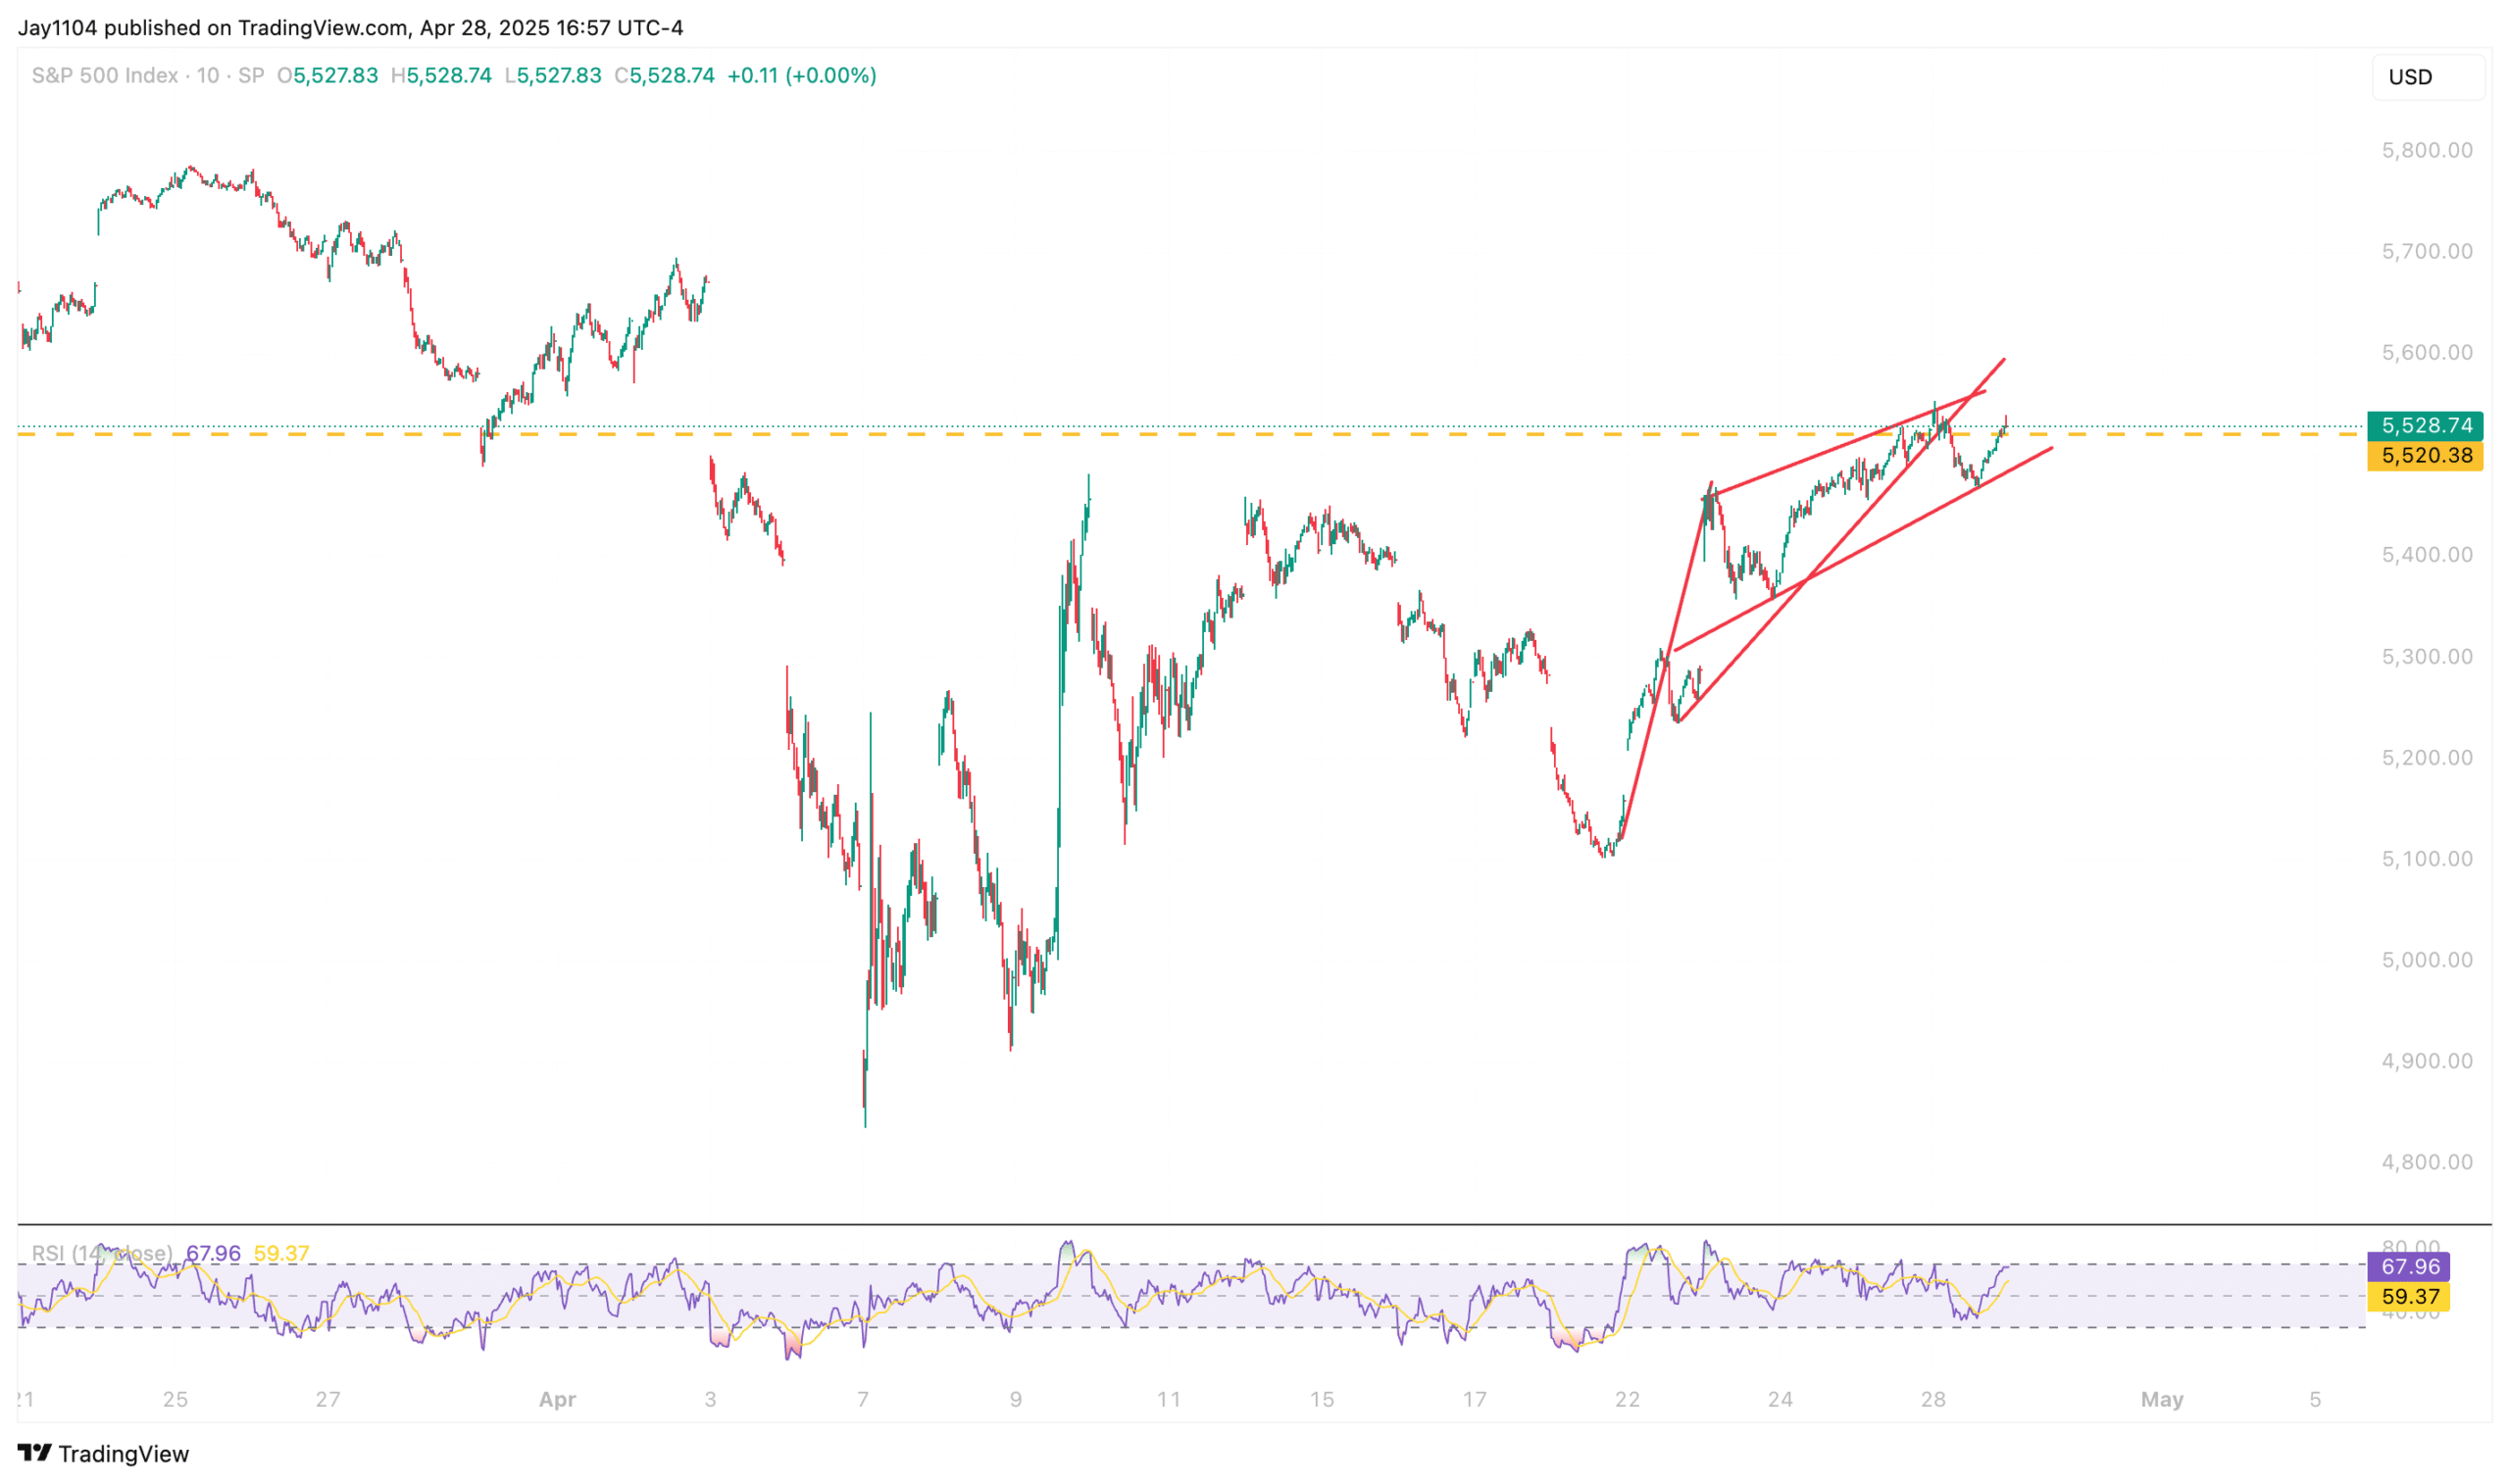
If you wanted to get a bit creative, you could actually argue that the index formed a rising flag pattern, which suggests the S&P 500 could return to the origin of the recent rally at around 5100.
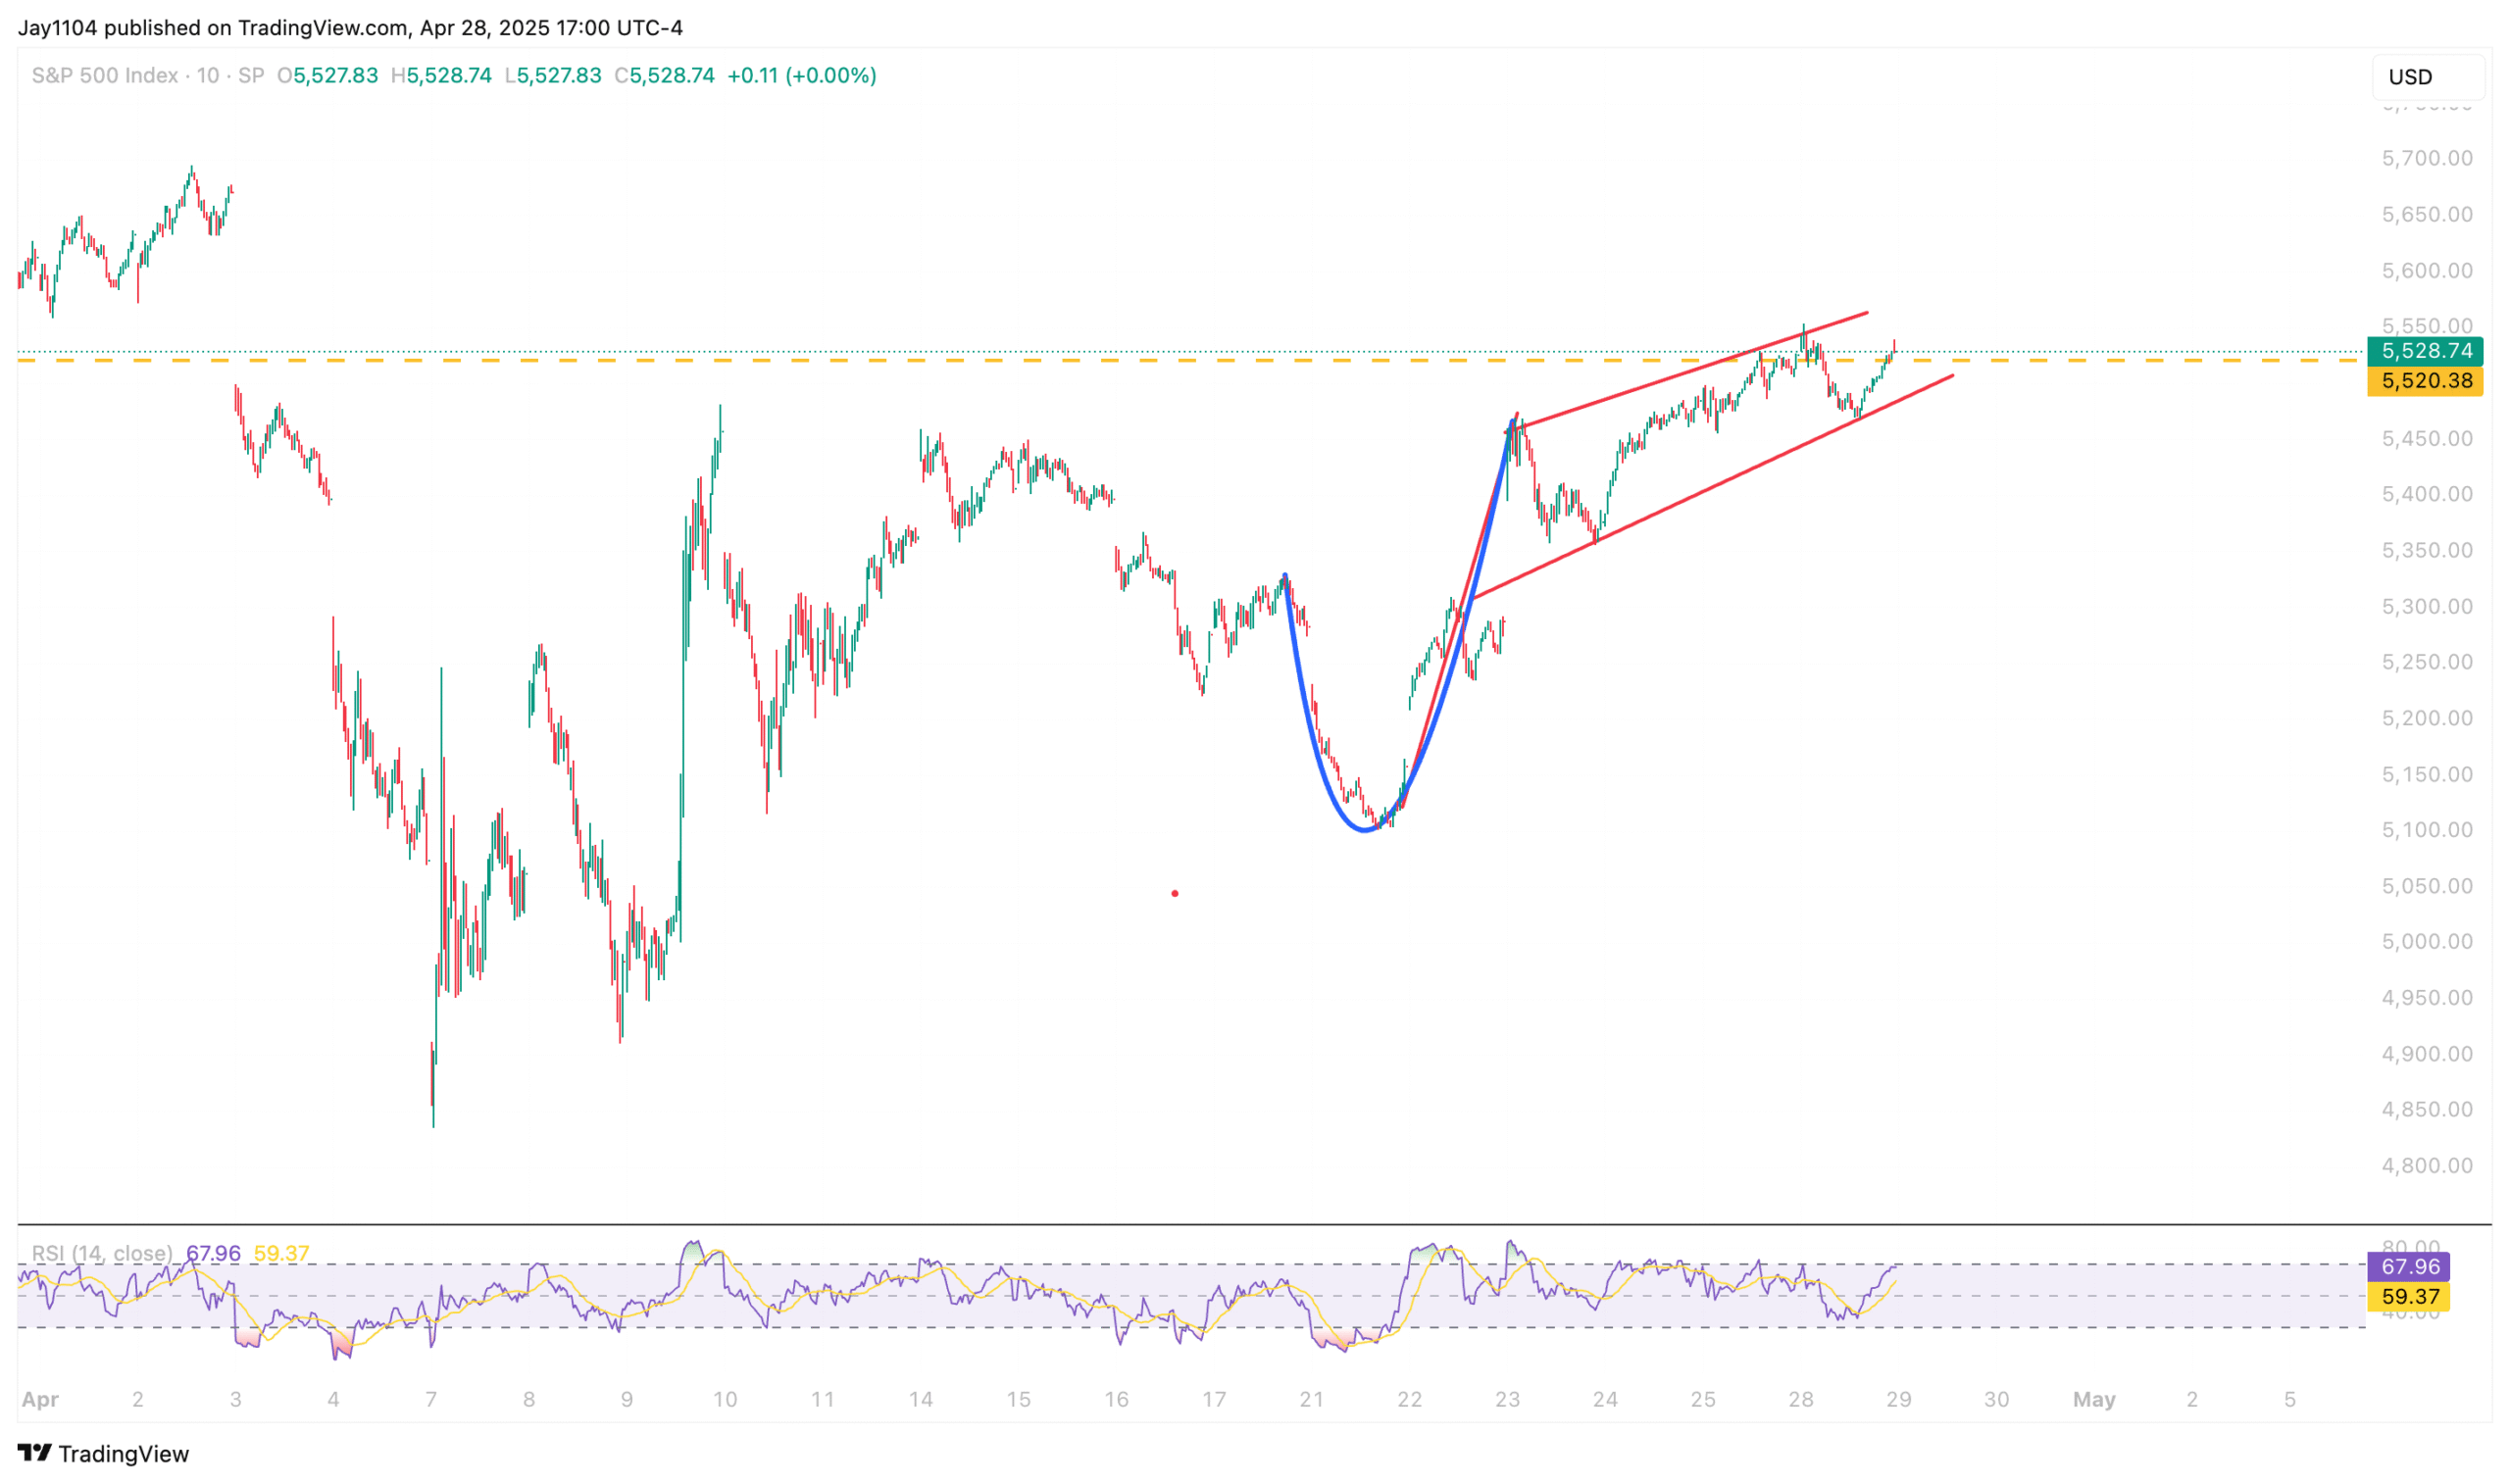
You could also argue that the pattern is a cup with an upward-sloping handle, which similarly suggests the S&P 500 may revisit the 5,100 level.
Anyway, we will see what tomorrow brings.
-Mike
Terms By ChatGPT
Equity Financing Costs:
The cost associated with financing equity positions via futures contracts or derivatives; essentially, the implied interest cost traders pay to maintain long positions.
CDX HY Credit Spreads:
A measure of credit risk in the high-yield (HY) corporate bond market, represented by the spread between CDX High Yield credit default swap indices and risk-free benchmark rates.
VIX 1-Day (VIX 1D):
A volatility index measuring expected stock-market volatility specifically for the next trading day, typically reacting sharply to upcoming event risk like economic data releases.
Rising Flag Pattern:
A technical analysis chart pattern characterized by a brief consolidation upward (flag) after a sharp downward move, often signaling a continuation of the preceding decline.
Cup with an Upward-Sloping Handle:
A variation of the “cup-and-handle” chart formation, where the handle portion slopes upward rather than downward, typically interpreted as bearish, suggesting a retracement to previous lower levels.
78% Intraday Retracement Level:
A specific Fibonacci retracement level indicating that the price has reversed after recovering roughly 78% of its previous decline within a single trading session. This level often signals potential reversal points for technical traders.
This report contains independent commentary to be used for informational and educational purposes only. Michael Kramer is a member and investment adviser representative with Mott Capital Management. Mr. Kramer is not affiliated with this company and does not serve on the board of any related company that issued this stock. All opinions and analyses presented by Michael Kramer in this analysis or market report are solely Michael Kramer’s views. Readers should not treat any opinion, viewpoint, or prediction expressed by Michael Kramer as a specific solicitation or recommendation to buy or sell a particular security or follow a particular strategy. Michael Kramer’s analyses are based upon information and independent research that he considers reliable, but neither Michael Kramer nor Mott Capital Management guarantees its completeness or accuracy, and it should not be relied upon as such. Michael Kramer is not under any obligation to update or correct any information presented in his analyses. Mr. Kramer’s statements, guidance, and opinions are subject to change without notice. Past performance is not indicative of future results. Neither Michael Kramer nor Mott Capital Management guarantees any specific outcome or profit. You should be aware of the real risk of loss in following any strategy or investment commentary presented in this analysis. Strategies or investments discussed may fluctuate in price or value. Investments or strategies mentioned in this analysis may not be suitable for you. This material does not consider your particular investment objectives, financial situation, or needs and is not intended as a recommendation appropriate for you. You must make an independent decision regarding investments or strategies in this analysis. Upon request, the advisor will provide a list of all recommendations made during the past twelve months. Before acting on information in this analysis, you should consider whether it is suitable for your circumstances and strongly consider seeking advice from your own financial or investment adviser to determine the suitability of any investment.