


From Oversold To Overbought In Only A Month

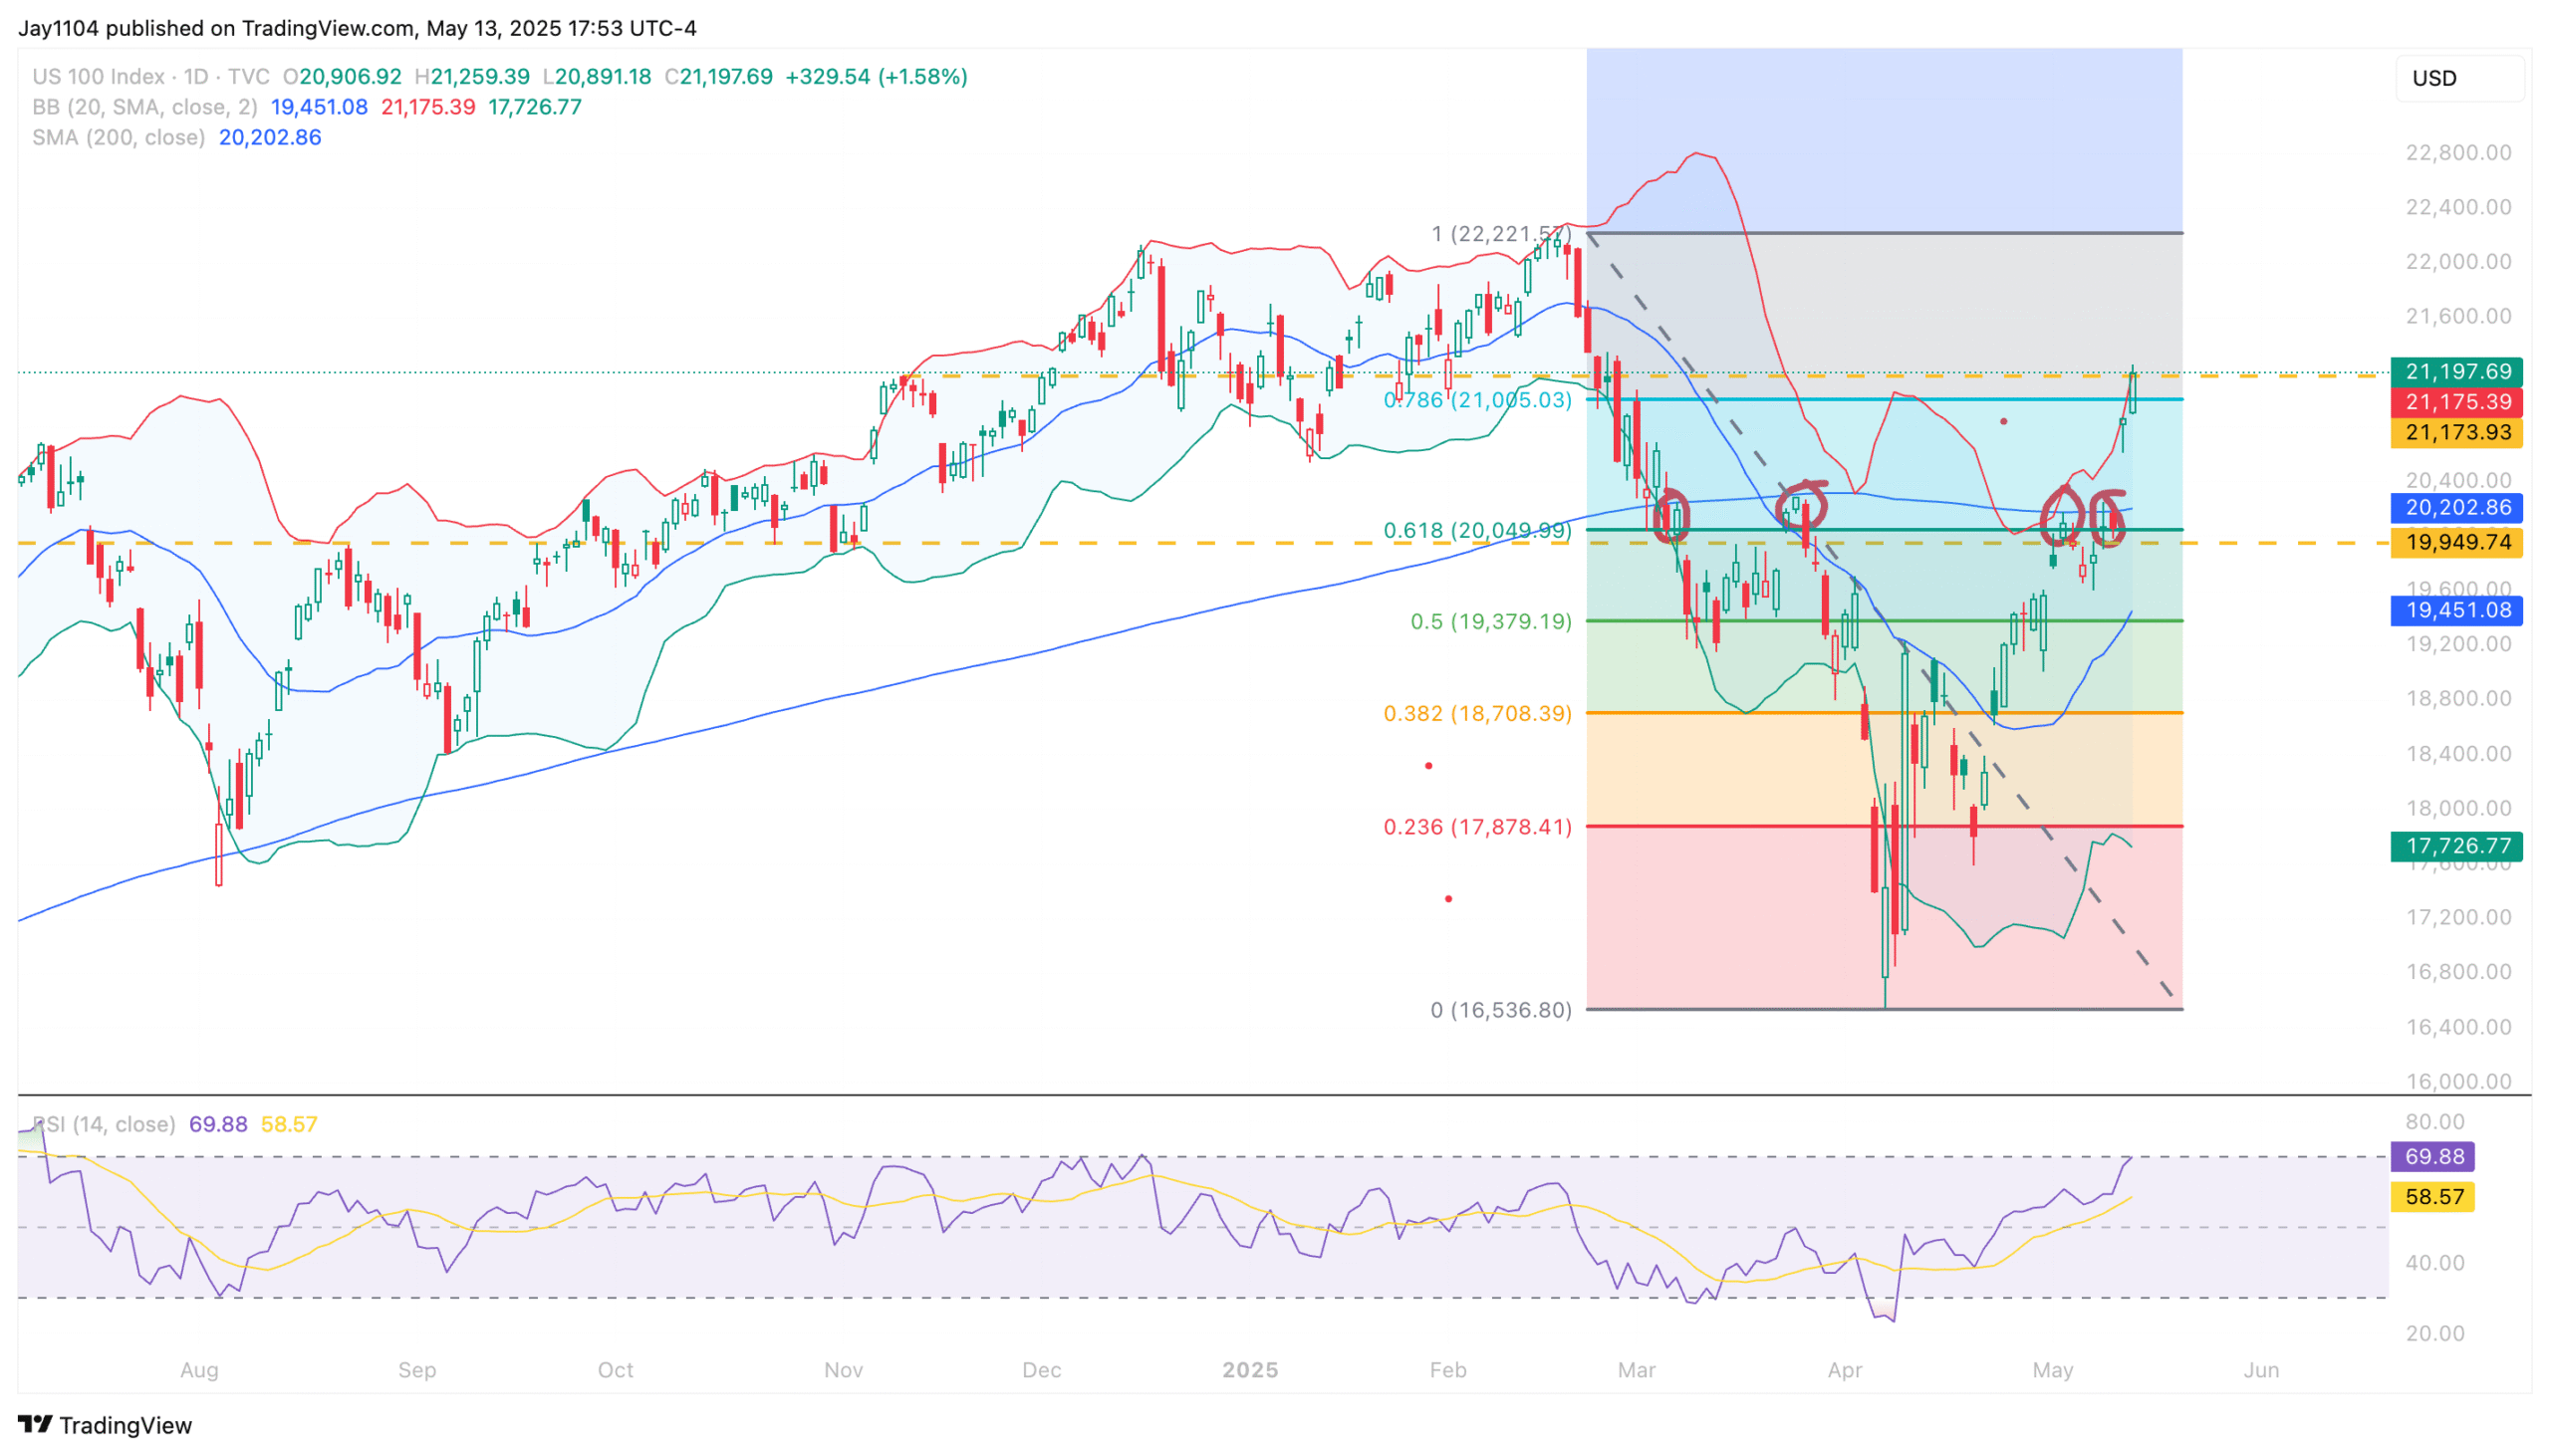
Stocks managed to rally again, and because of the speed of the rally over the last two days, it took the NASDAQ 100 into an overbought position, with the index crossing above the upper Bollinger Band and the RSI rising to 70. We have seen these conditions before, and we know that when these things tend to happen, the asset consolidates sideways or pulls back. It also seems like a reasonable place for resistance, given the prior support/resistance in this region.
Hard to believe that the indexes were oversold a month ago.
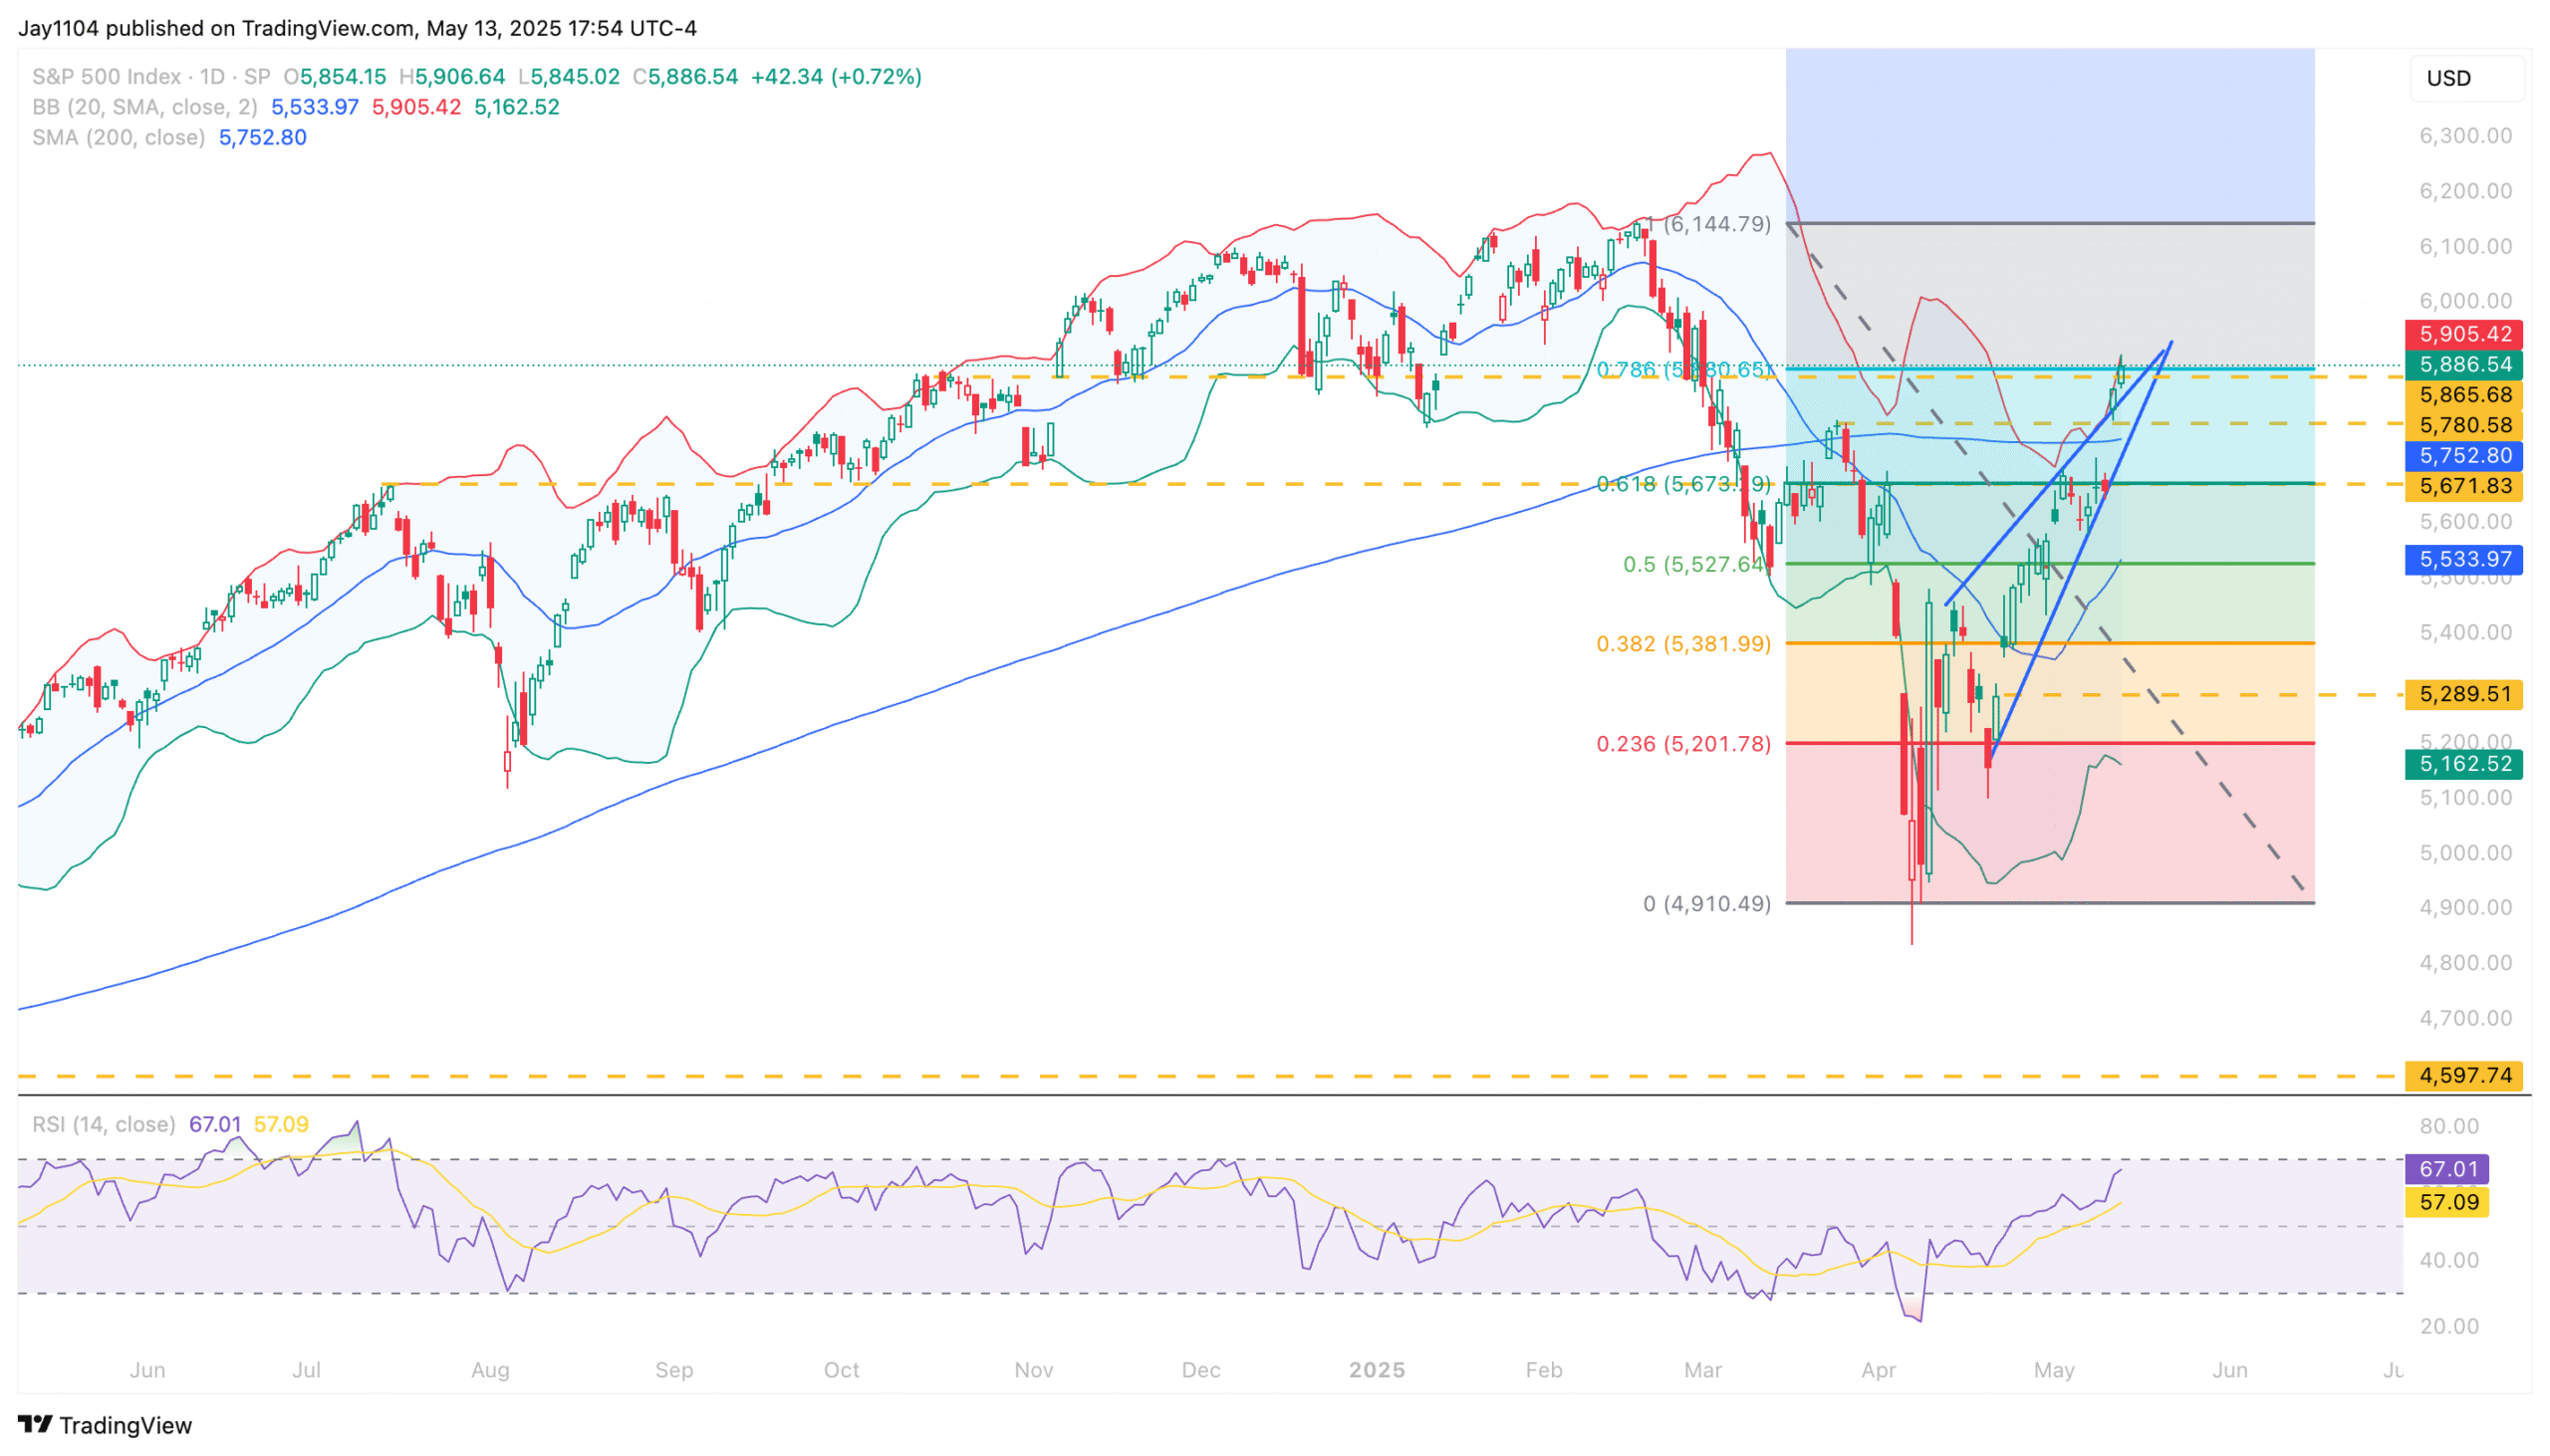
It is similar to the S&P 500; add in the fact that the index reached the 78.6% retracement level. So, just like last week, which presented that opportunity at 61.8%, this week presents a new opportunity. The facts are that both indices are at the upper end of their Bollinger bands, with the NASDAQ at 70 on the RSI and the S&P 500 nearing 70. The 78.6% retracement level is also present for the S&P 500; there is no denying that. So when you start seeing multiple indicators pointing to something, it becomes hard to ignore.
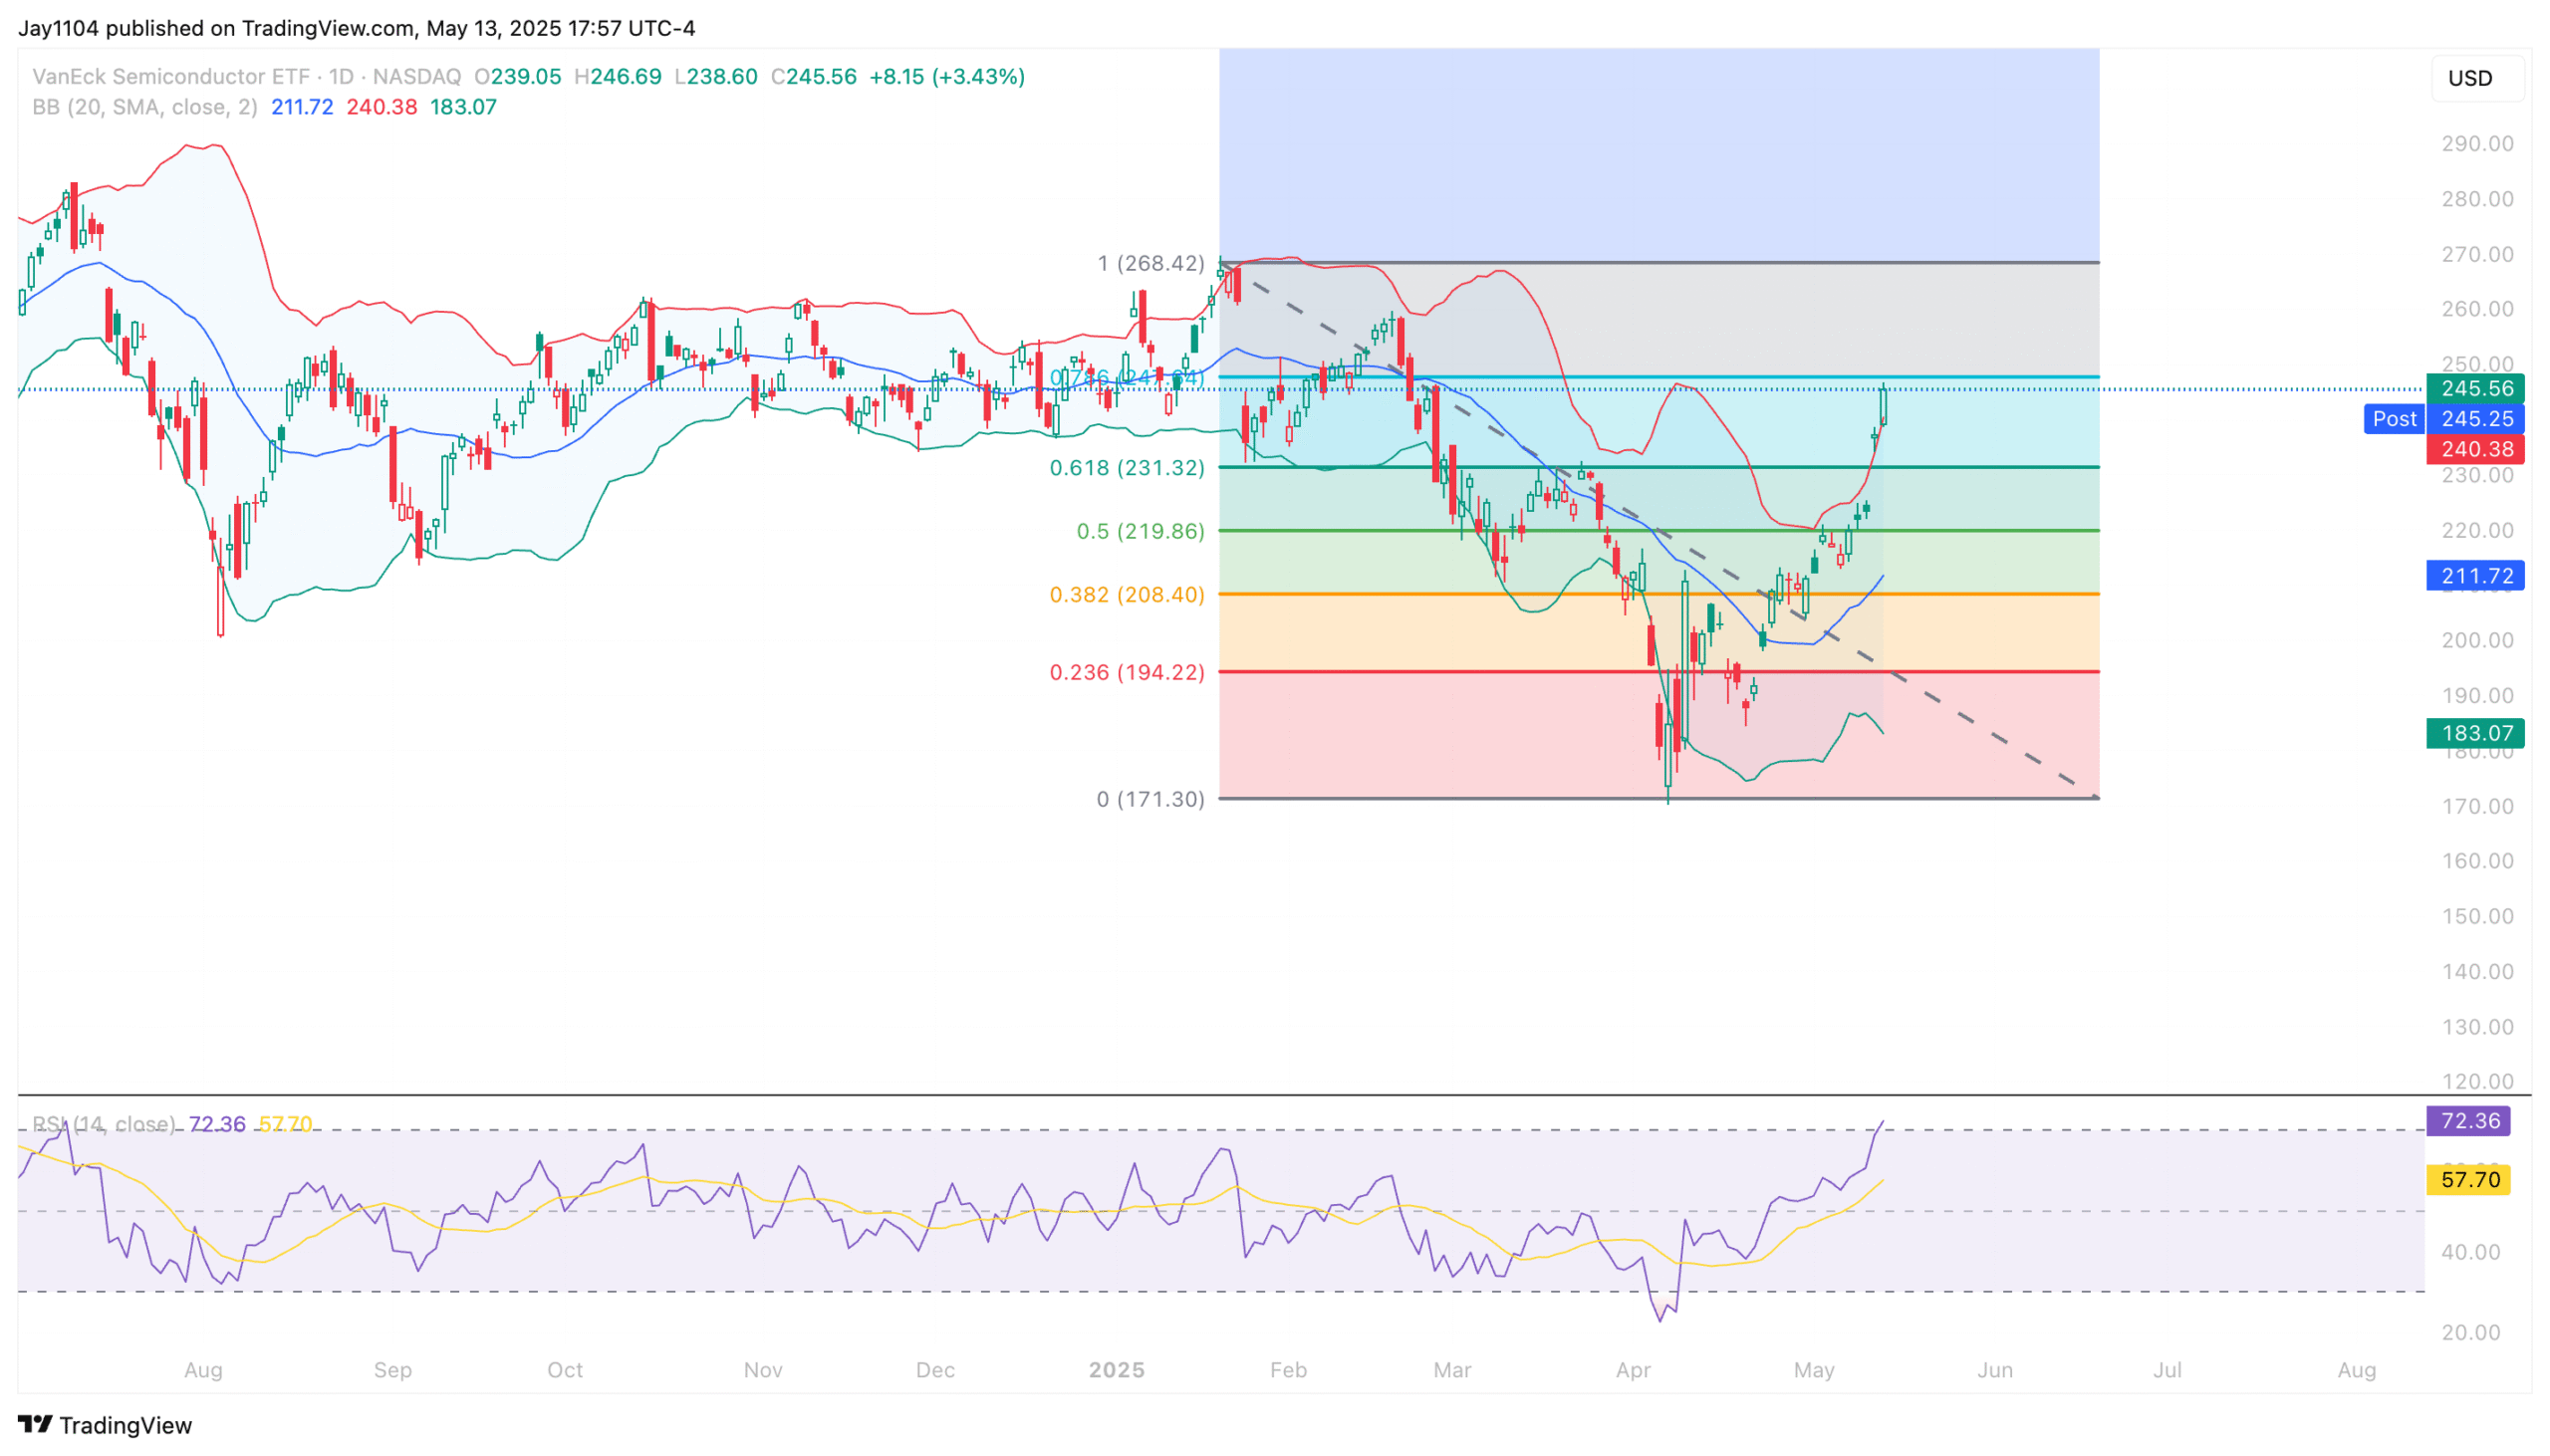
It is the same story for the Semi SMH ETF.
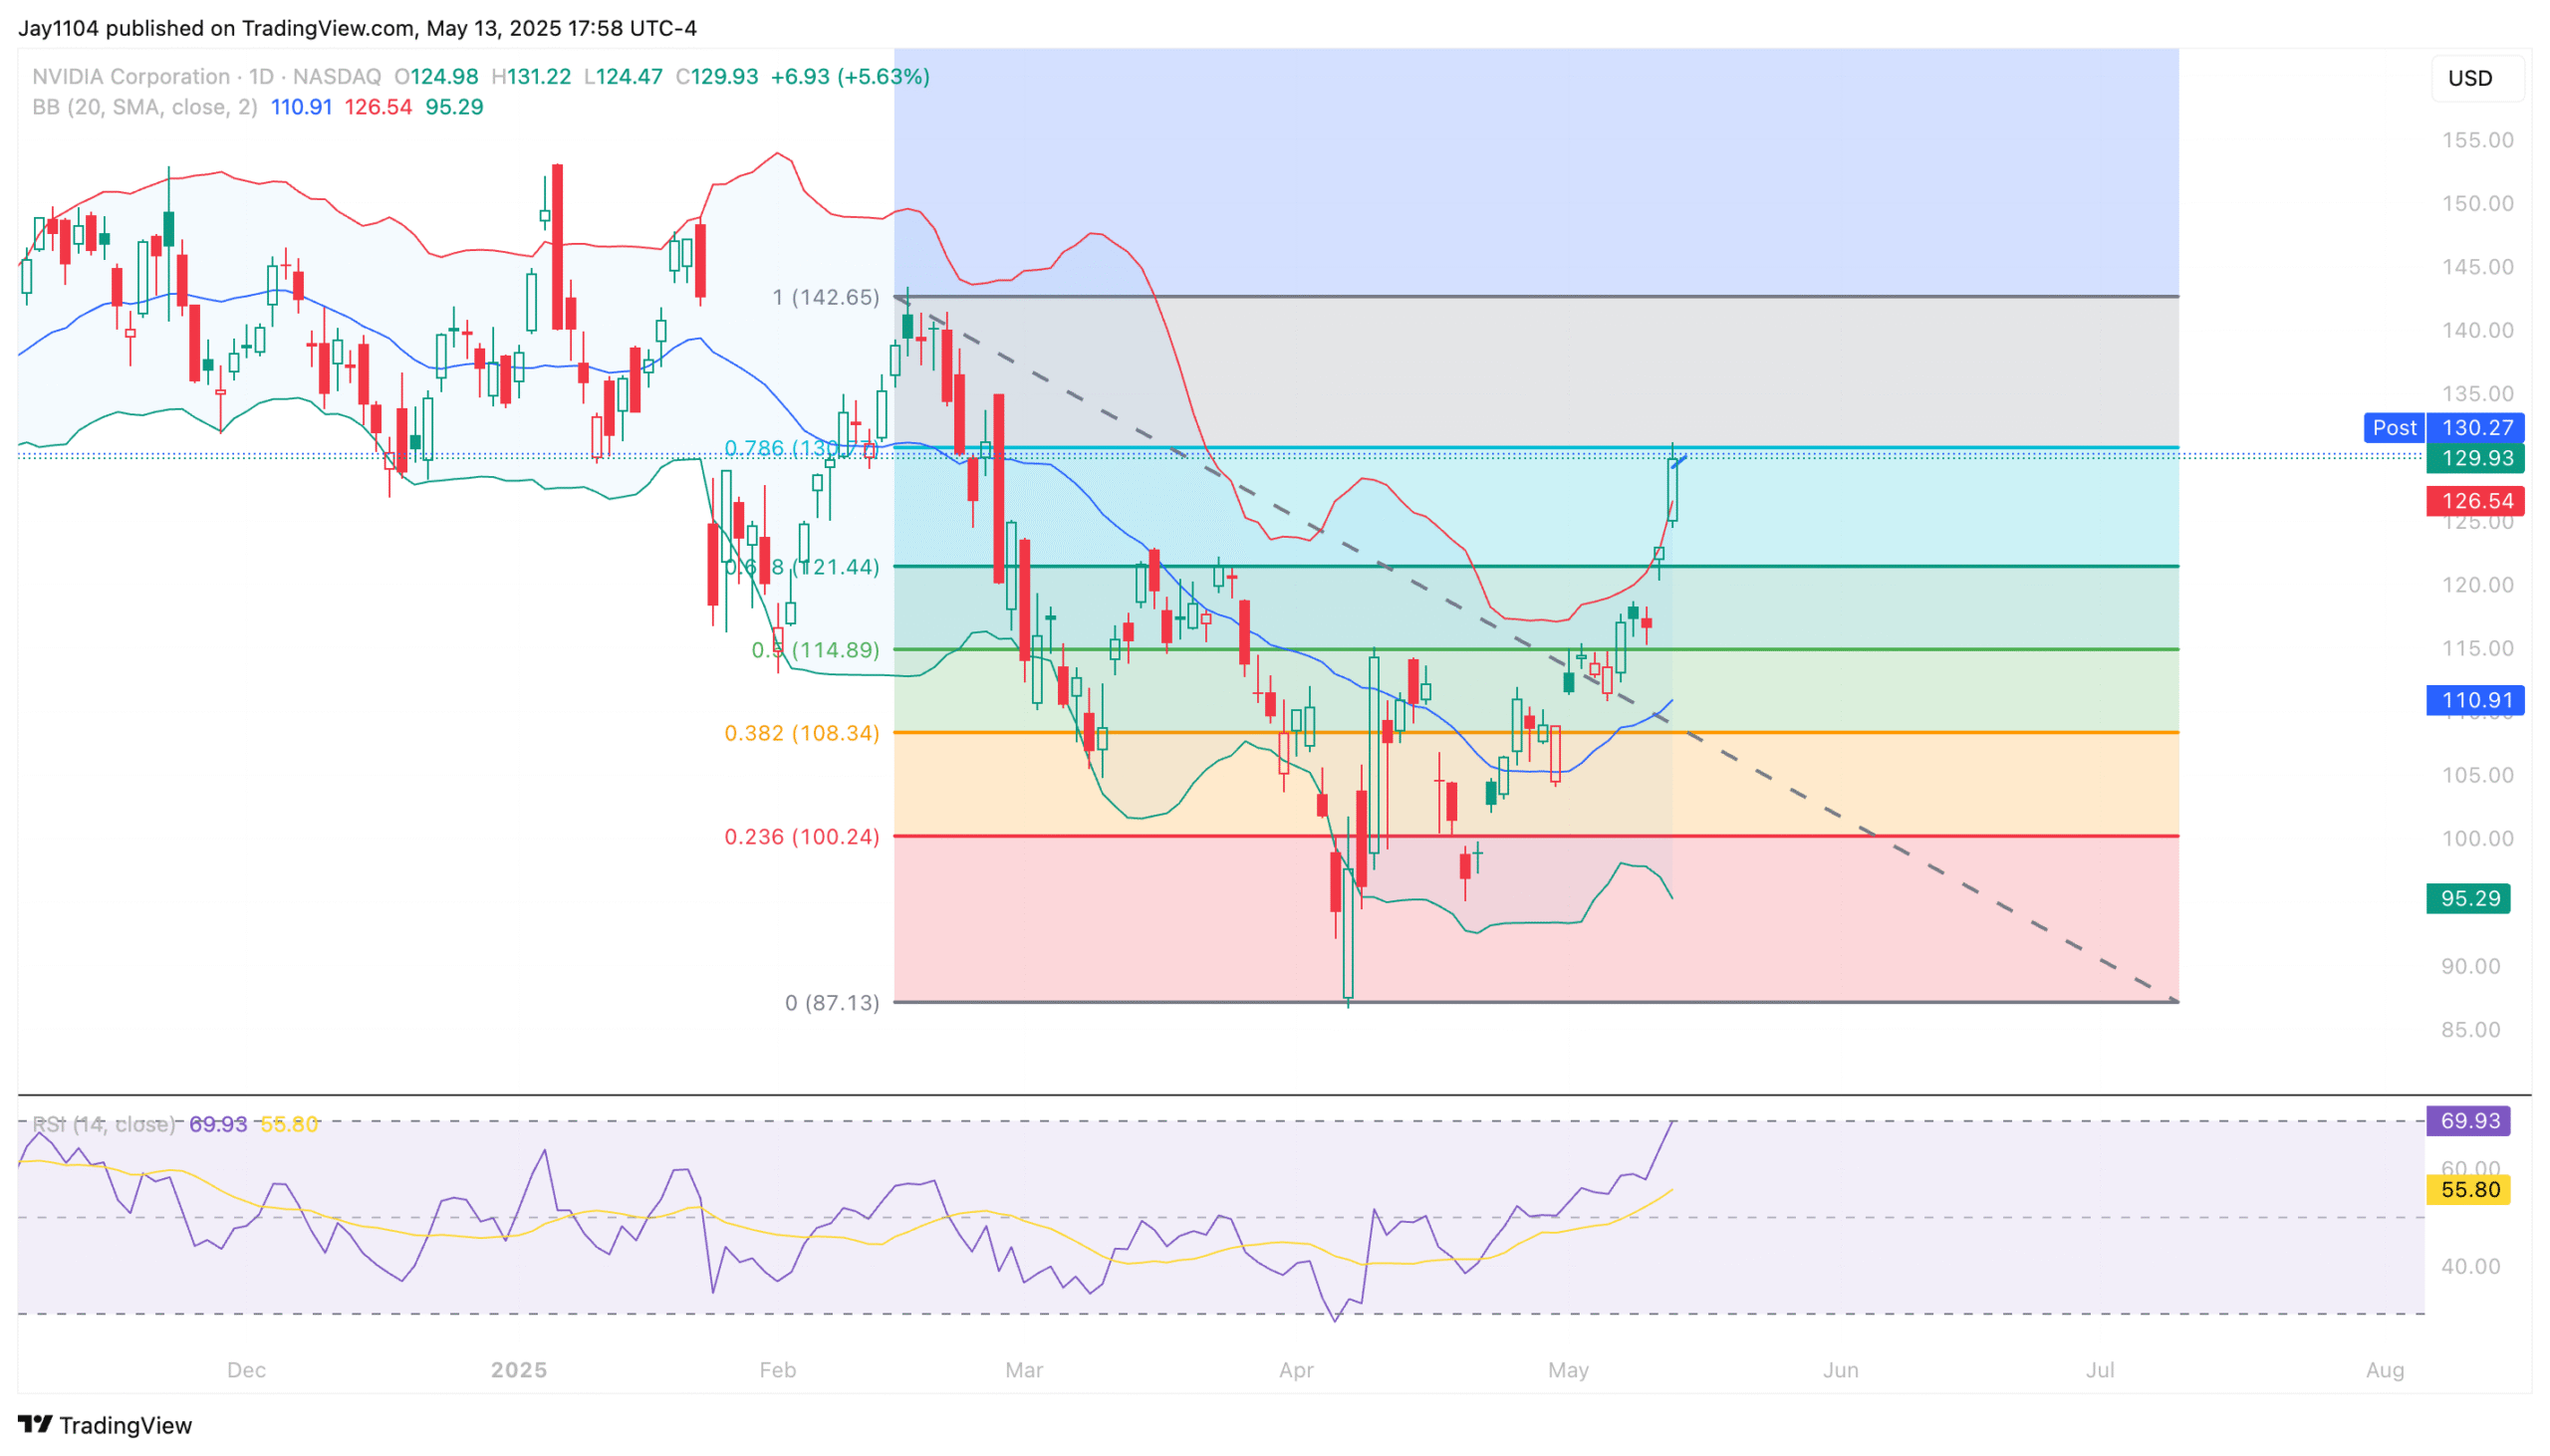
Nvidia finds itself in a similar spot.
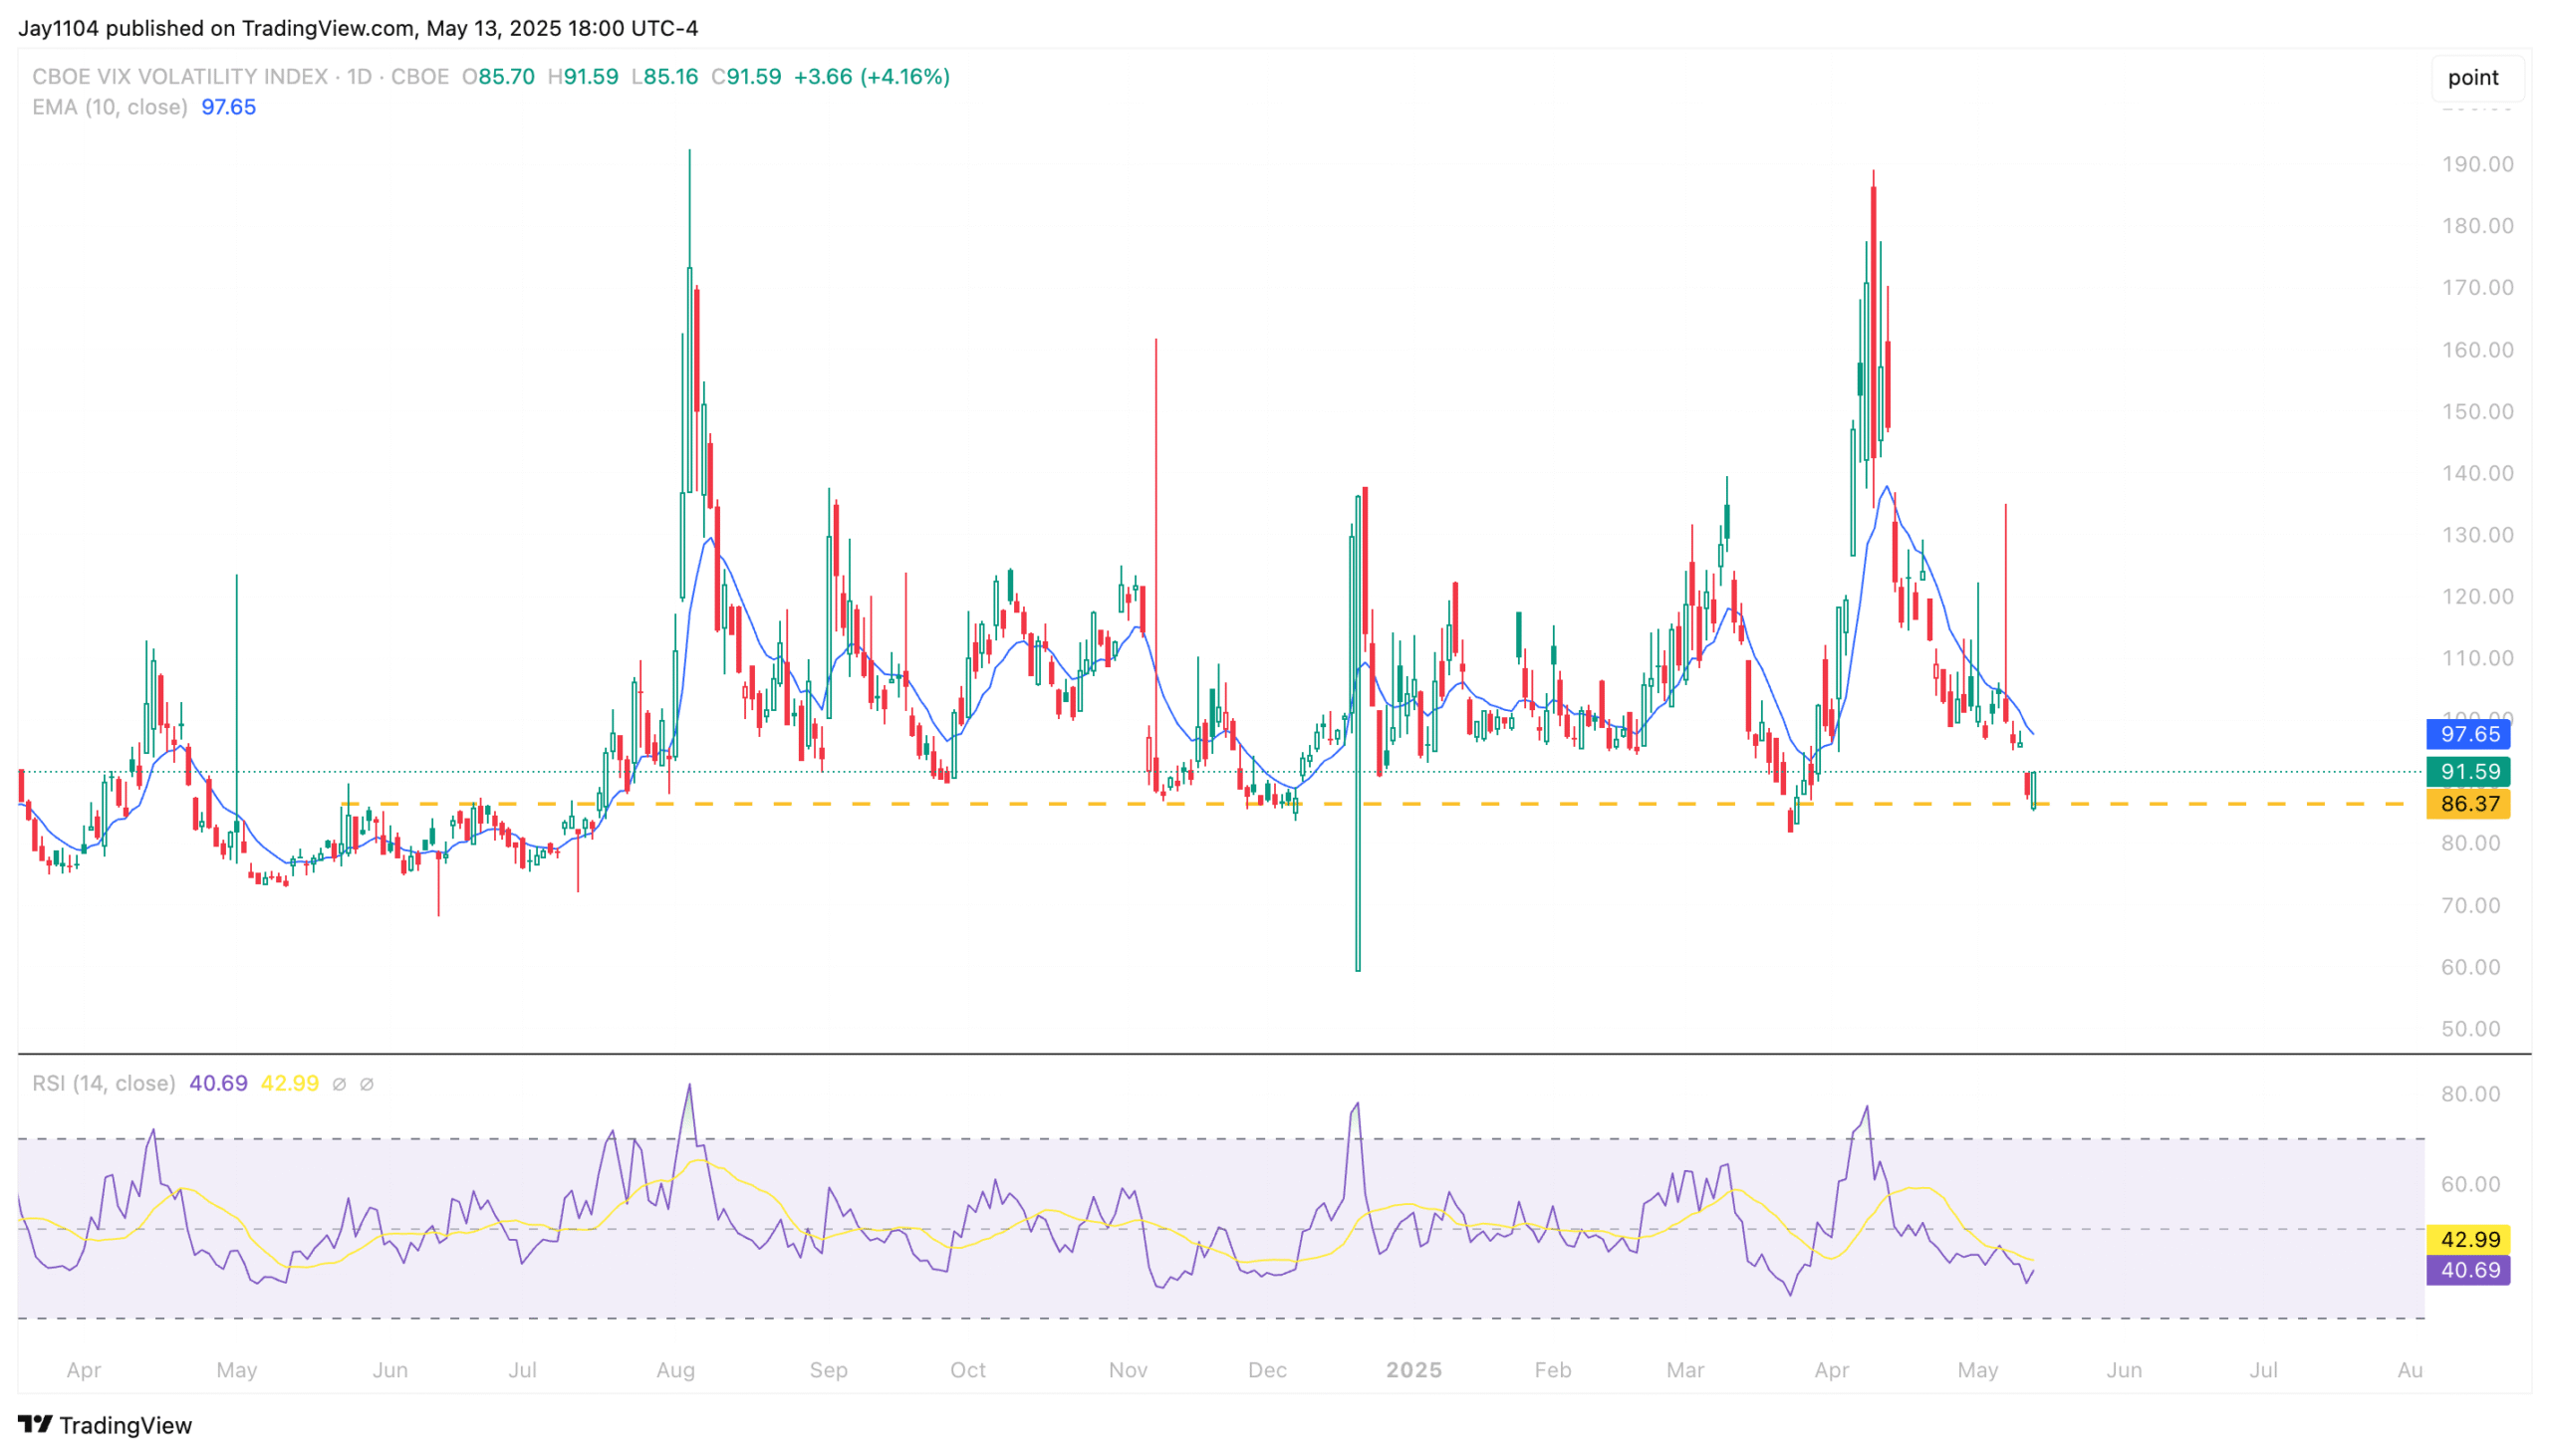
It is also worth pointing out that the VVIX traded higher today. That is important because if the VVIX continues to move higher, the VIX tends to follow. We can see that the IV has been completely reset for the most part.
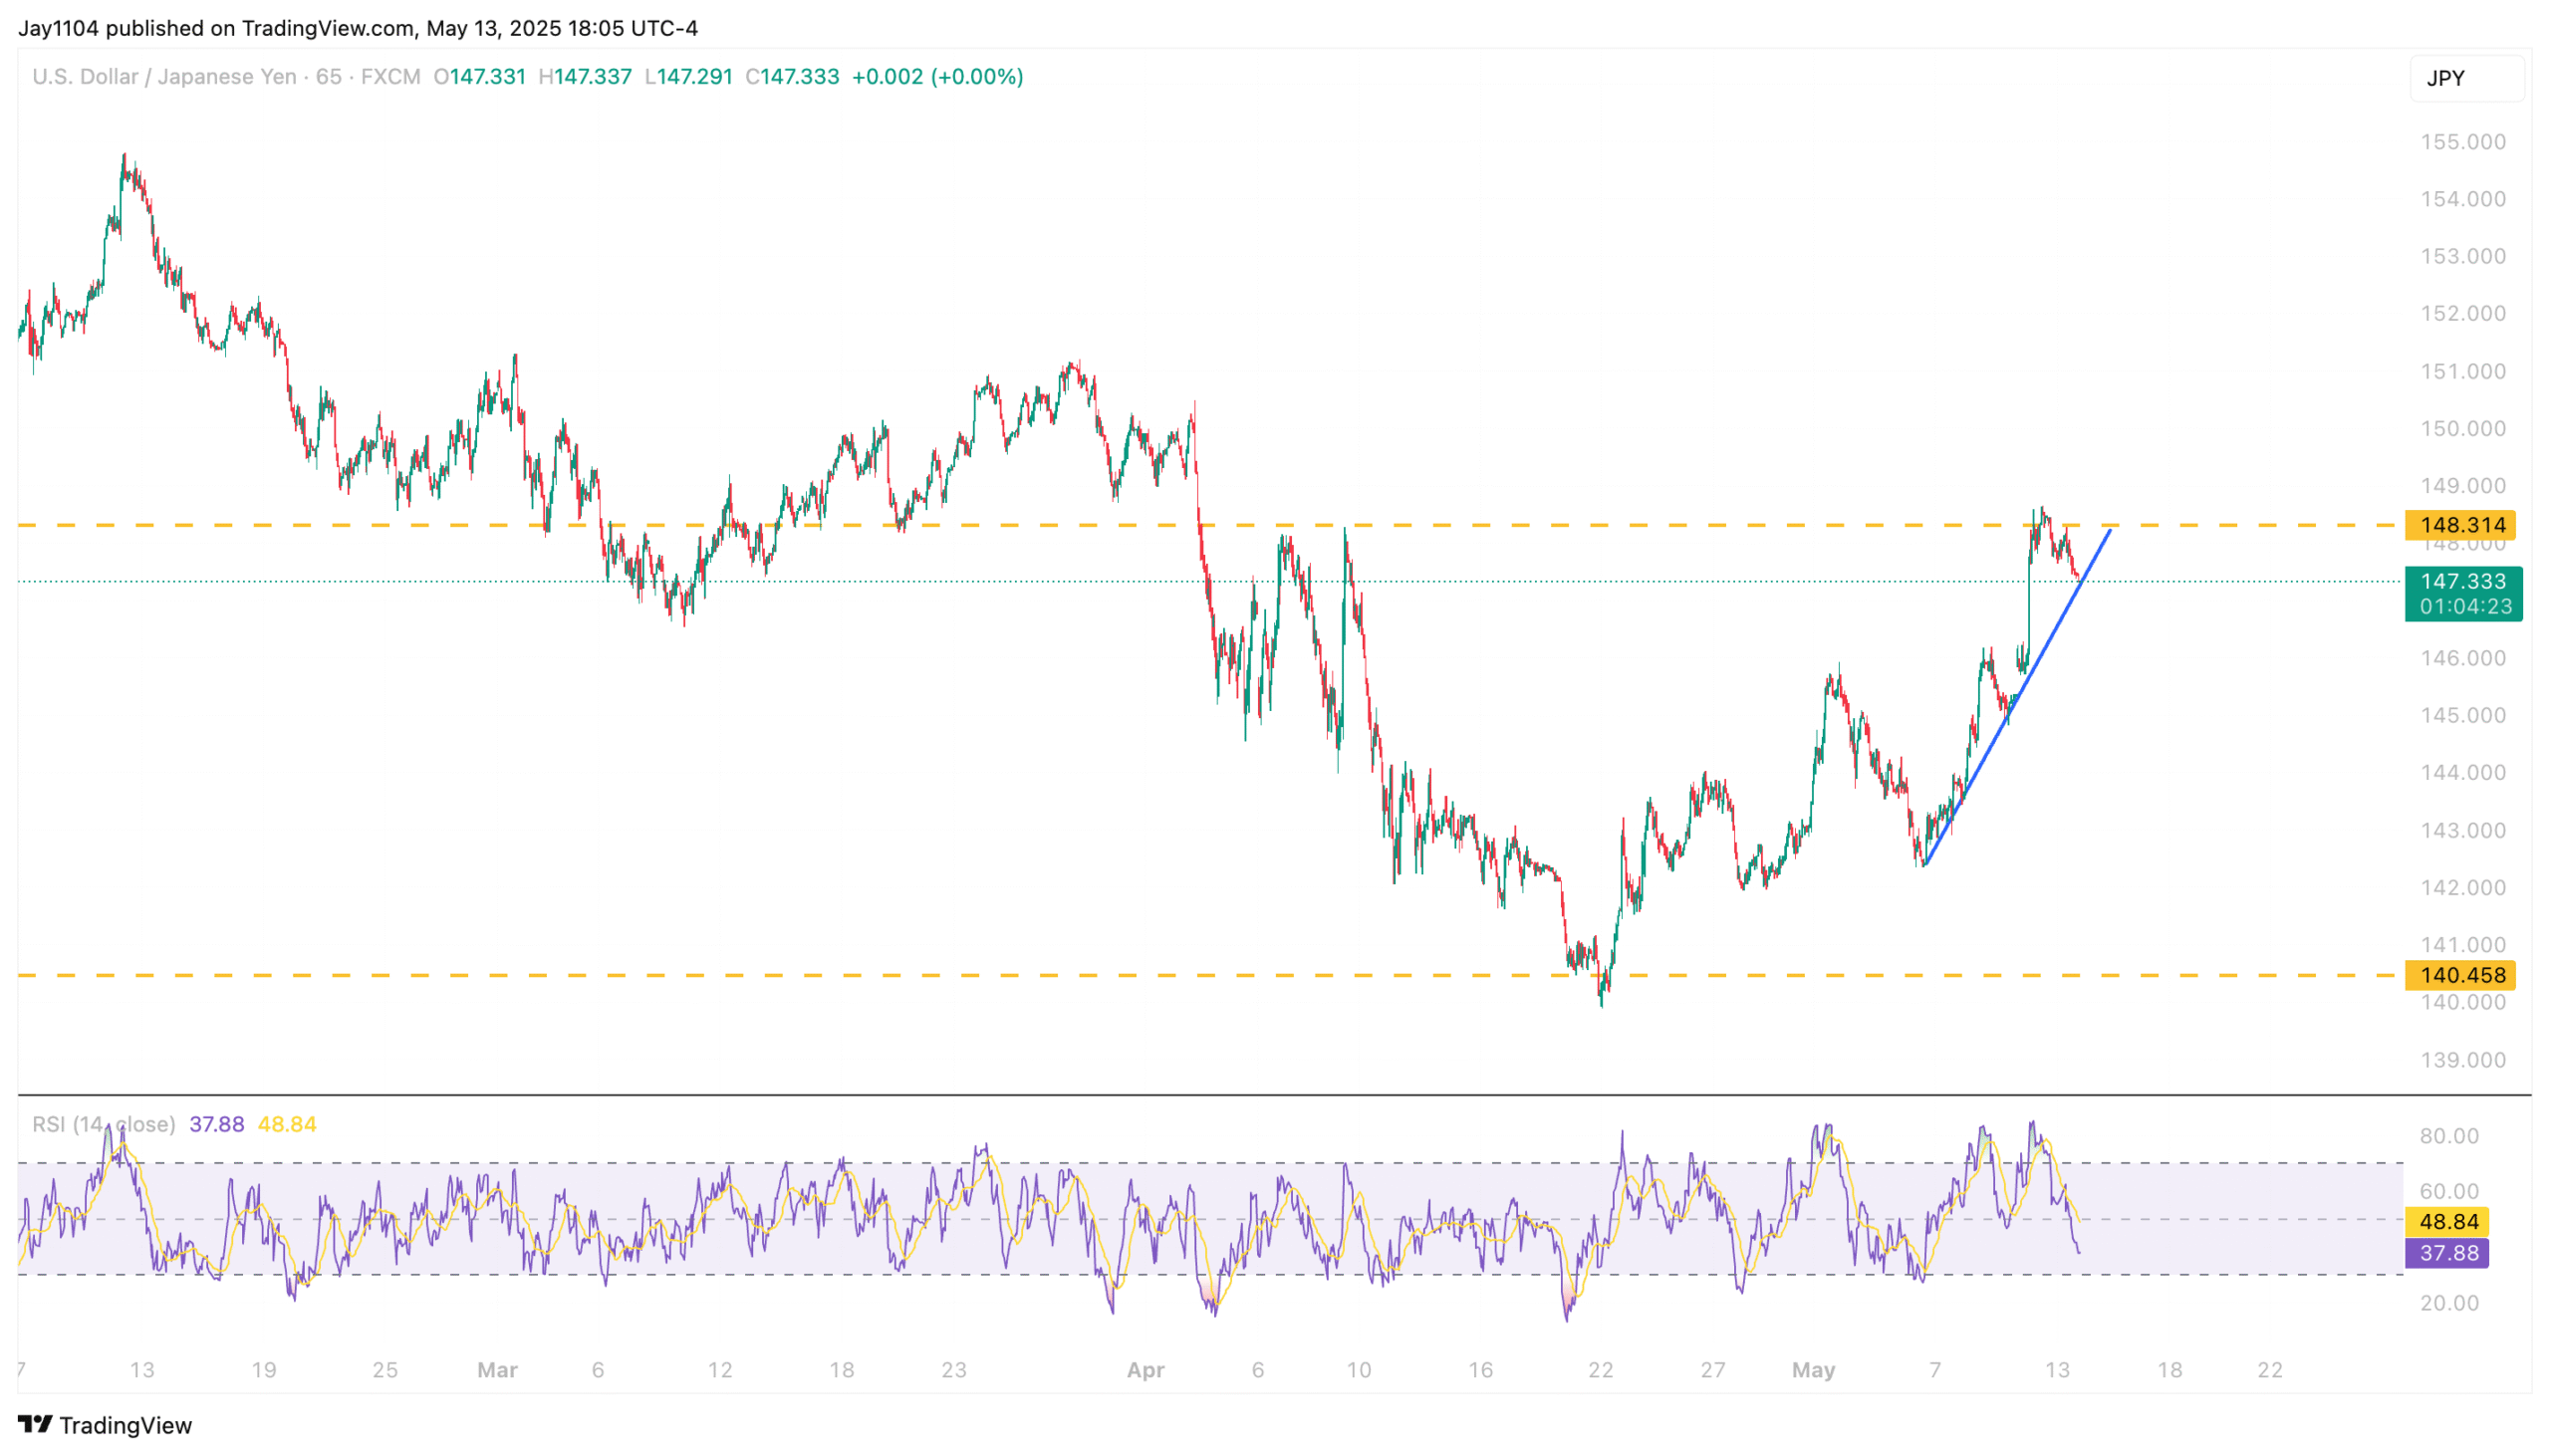
The dollar was weaker today than almost everything, with the USDJPY moving lower back below 148. The USDJPY is on the trend line, and breaking that trend will probably lead to the USDJPY strengthening back into the 145s.
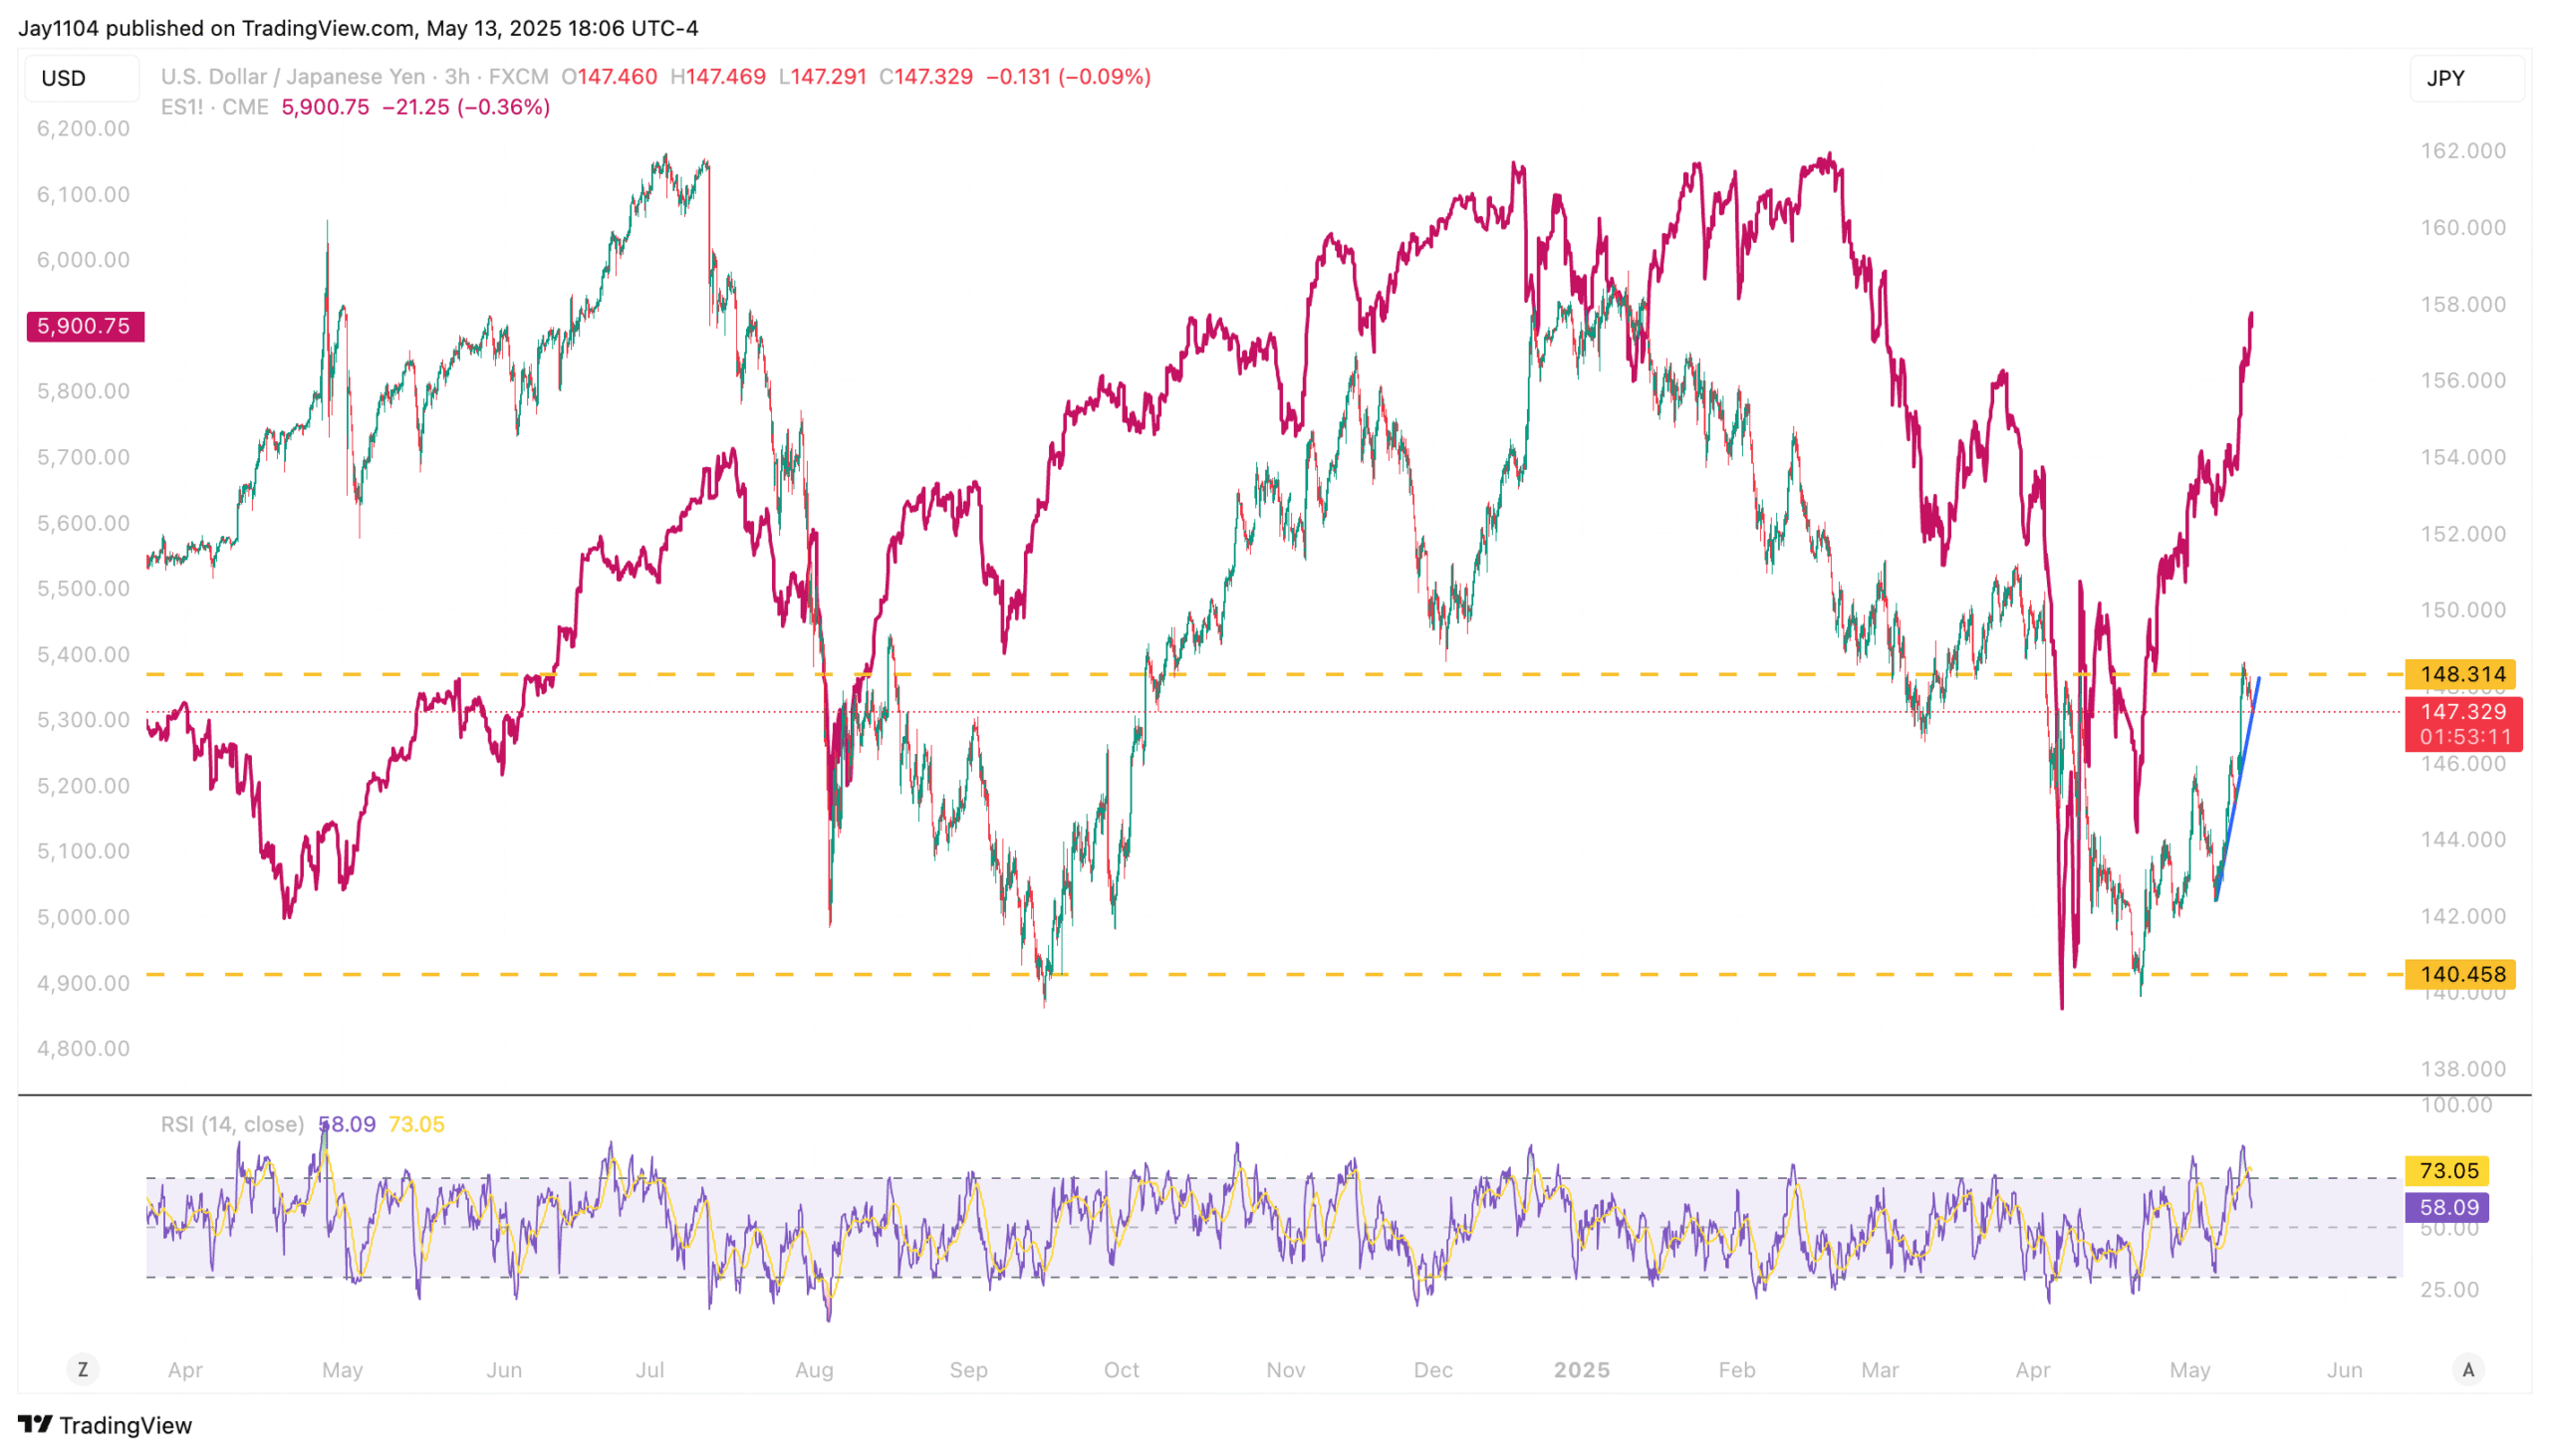
For the most part, the S&P 500 and the USDJPY have moved together. Perhaps they are due to separate and decouple. It is possible, but close attention will still be needed.
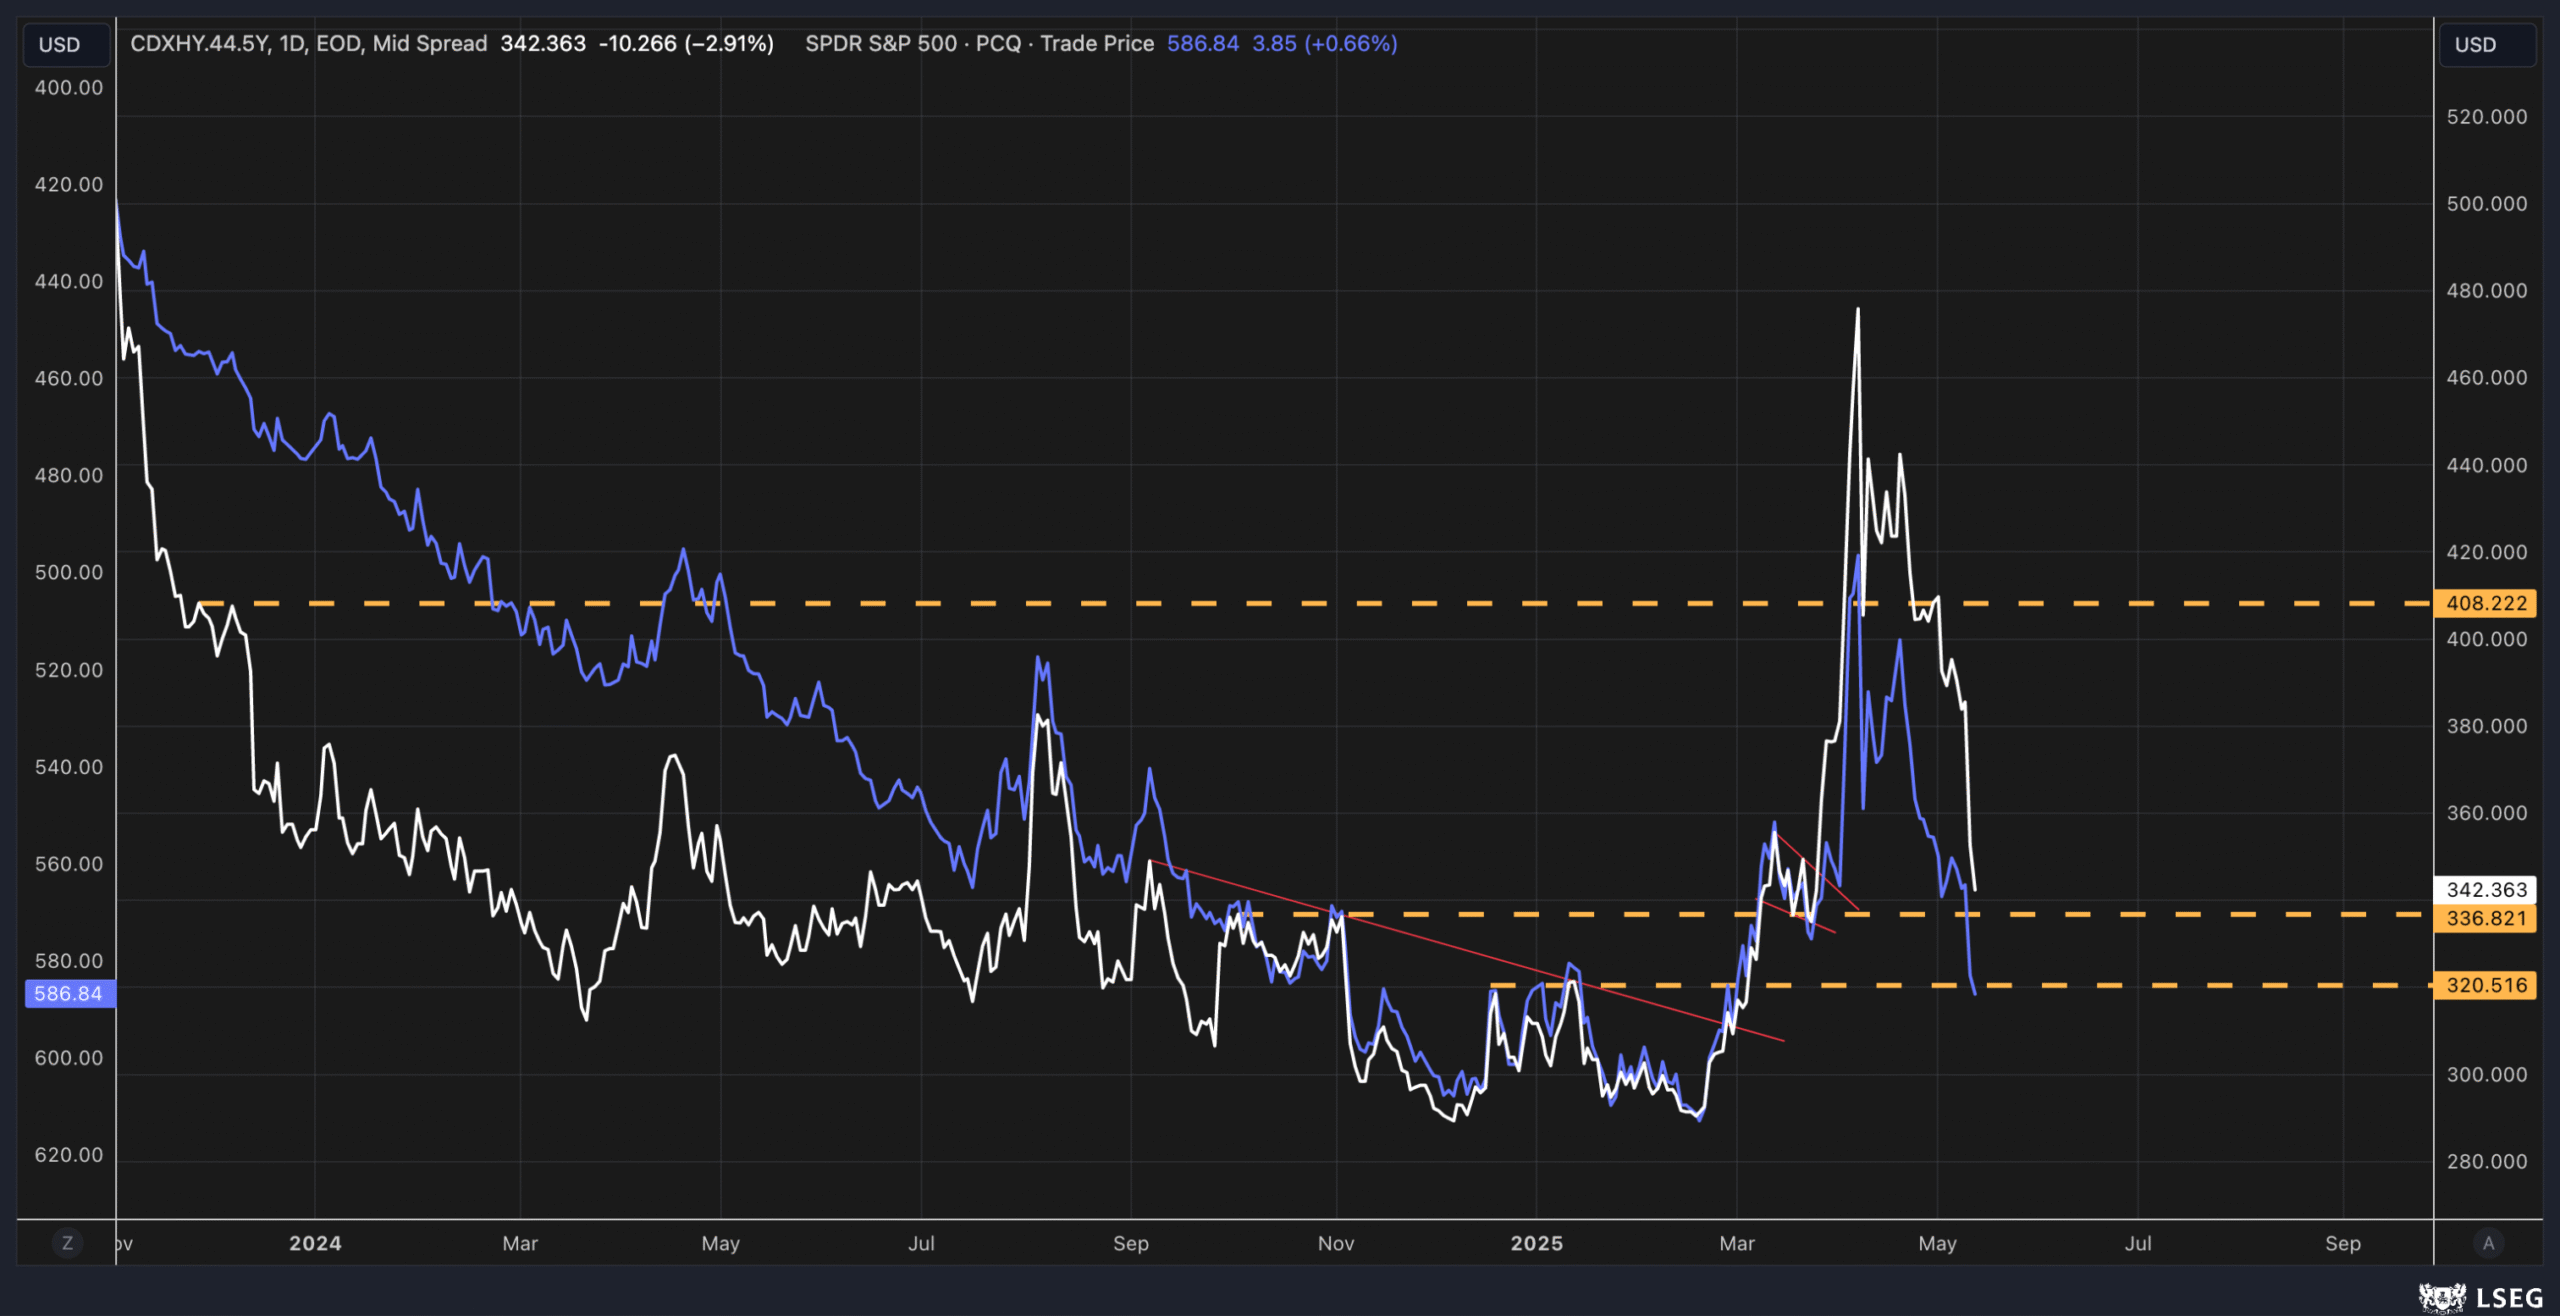
We have also seen credit spreads tighten, but those are still above the breakout level 336. We know that stocks trade with spreads.
With that said...
Mike
Overbought: Condition where prices have risen quickly and substantially, making the asset appear expensive and likely to reverse or consolidate.
Bollinger Band: A technical indicator consisting of a centerline (moving average) and two bands (standard deviations from the moving average), indicating volatility and potential reversal points.
RSI (Relative Strength Index): A momentum oscillator ranging from 0 to 100 that measures recent price changes to evaluate overbought or oversold conditions. Typically, values above 70 indicate an overbought market; values below 30 indicate oversold.
Consolidating Sideways: Period where prices move within a narrow range without a clear upward or downward trend, typically signaling market indecision.
Retracement Levels (Fibonacci): Levels calculated from a prior move’s highs and lows, suggesting likely reversal or support/resistance points; commonly used levels are 23.6%, 38.2%, 50%, 61.8%, and 78.6%.
Semi SMH ETF: VanEck Semiconductor ETF (SMH), tracks semiconductor stocks like Nvidia, AMD, and Intel.
VVIX: Measures volatility of volatility; specifically, implied volatility of VIX options. Rising VVIX often precedes rising VIX (volatility), indicating growing market uncertainty.
IV (Implied Volatility): A measure of expected future volatility implied by options prices. Higher IV suggests greater anticipated volatility.
USDJPY: Exchange rate between the US Dollar (USD) and Japanese Yen (JPY); lower values mean a stronger yen, while higher values mean a weaker yen.
Credit Spreads: Difference in yield between corporate bonds and comparable maturity government bonds, indicating market perception of risk and economic conditions. Tightening spreads indicate decreasing risk perceptions; widening spreads indicate increasing risk perceptions.
This report contains independent commentary to be used for informational and educational purposes only. Michael Kramer is a member and investment adviser representative with Mott Capital Management. Mr. Kramer is not affiliated with this company and does not serve on the board of any related company that issued this stock. All opinions and analyses presented by Michael Kramer in this analysis or market report are solely Michael Kramer’s views. Readers should not treat any opinion, viewpoint, or prediction expressed by Michael Kramer as a specific solicitation or recommendation to buy or sell a particular security or follow a particular strategy. Michael Kramer’s analyses are based upon information and independent research that he considers reliable, but neither Michael Kramer nor Mott Capital Management guarantees its completeness or accuracy, and it should not be relied upon as such. Michael Kramer is not under any obligation to update or correct any information presented in his analyses. Mr. Kramer’s statements, guidance, and opinions are subject to change without notice. Past performance is not indicative of future results. Neither Michael Kramer nor Mott Capital Management guarantees any specific outcome or profit. You should be aware of the real risk of loss in following any strategy or investment commentary presented in this analysis. Strategies or investments discussed may fluctuate in price or value. Investments or strategies mentioned in this analysis may not be suitable for you. This material does not consider your particular investment objectives, financial situation, or needs and is not intended as a recommendation appropriate for you. You must make an independent decision regarding investments or strategies in this analysis. Upon request, the advisor will provide a list of all recommendations made during the past twelve months. Before acting on information in this analysis, you should consider whether it is suitable for your circumstances and strongly consider seeking advice from your own financial or investment adviser to determine the suitability of any investment.