Stocks See A Massive Rally, But The Upside Seems Limited For Now
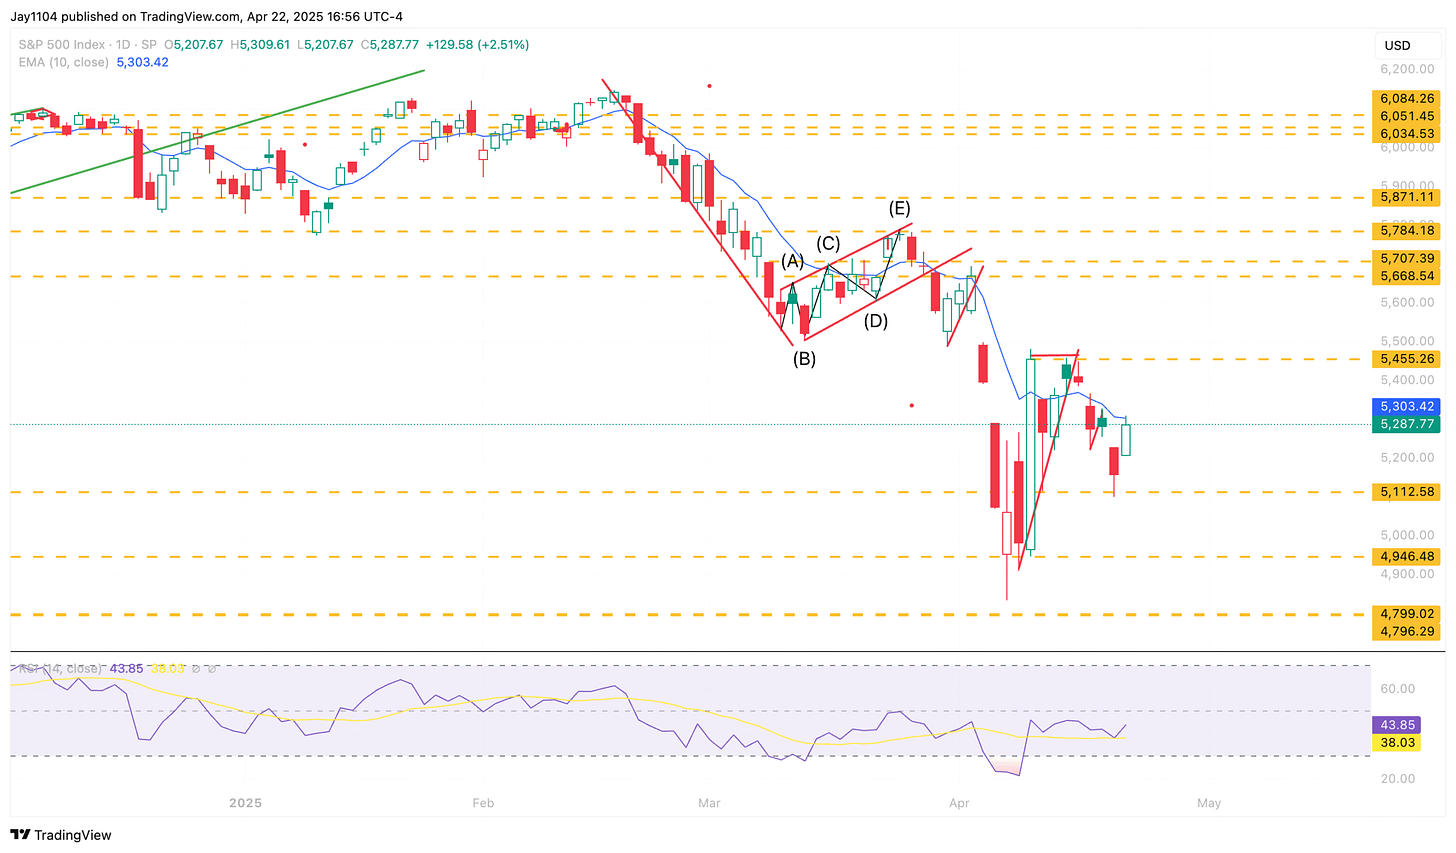
Stocks rallied on Tuesday, managing to reclaim the losses from Monday. The rally appears to be one of those negative gamma rallies, that is, options-induced, and has more options-related hedging flows than anything else.
You could sense last night that the "powers" were setting up today for something like this, with the 1% overnight gain that had no legs to stand on. We see this type of thing time and again, but I'm not sure if anything has changed. More importantly, the S&P 500 today reached the 10-day exponential moving average, and that is where it failed. So that appears to be resistance for now.
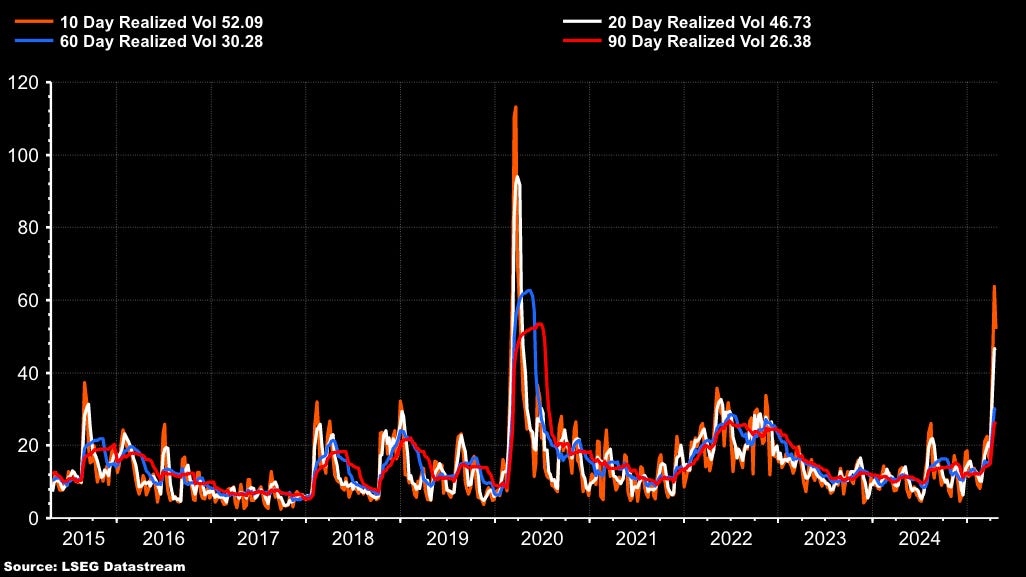
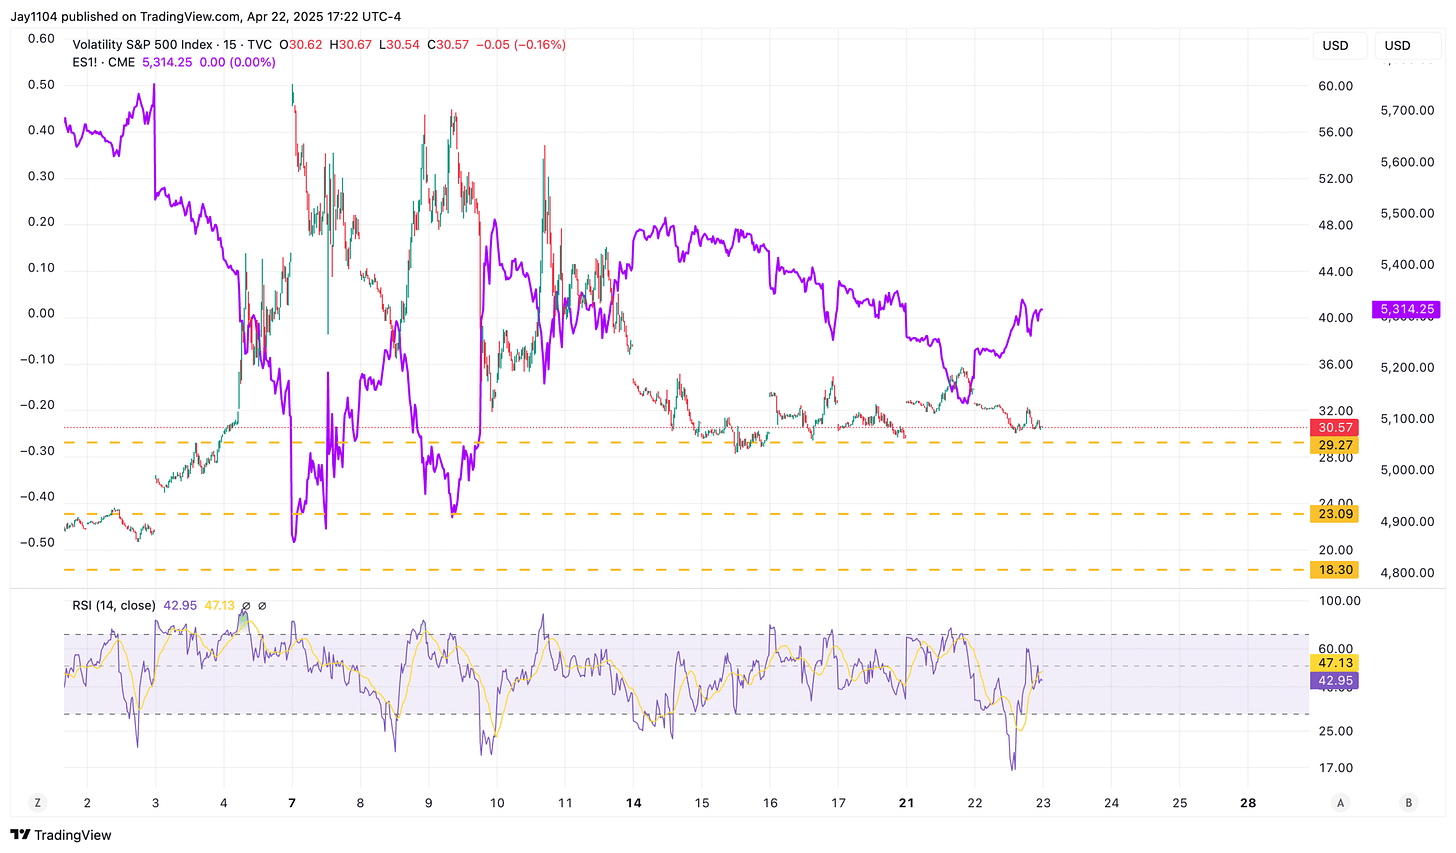
When you look at the VIX index at 30 and see 10- and 20-day realized volatility at COVID-like levels. You can only help but wonder. It's almost as if the market is saying that all of this trade war-related uncertainty is going to vanish magically. Even the 60-day realized volatility is at 30.
So, you could see today that at least 30 was acting as a floor for the VIX, which limited the S&P 500. It has been flat for a few days now, and as long as that is the case, I think the S&P 500 will continue to form lower highs and lower lows.
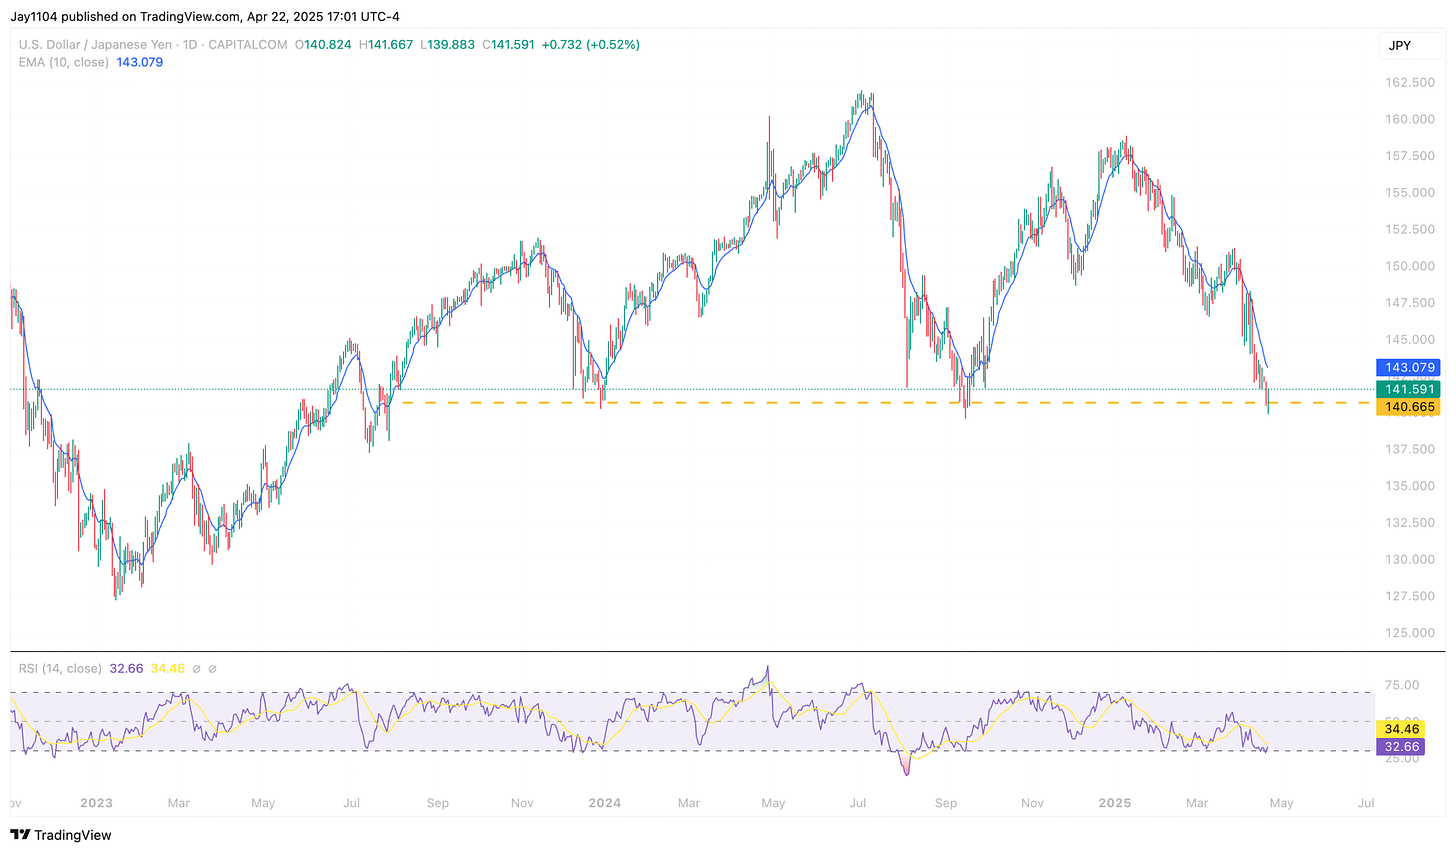
In the meantime, the USDJPY weakened to 141.59, and it managed to survive a test of support, with a brief break below 140. Where the USDJPY seems to go is what matters, and as of right now we do not have a good answer. Most of the types of news we need that could break this stalemate won't come until next week unless there is additional tariff news.
Outside of that, I don't think there was much else going on, just the usual daily noise.
-Mike
Negative gamma rally – A market rally driven by options trading activity, specifically when market makers hedge their positions by buying stock as prices rise, intensifying the rally. “Gamma” is a measure of how much the delta (price sensitivity) of an option changes with the underlying asset’s price.
Options-induced / options-related hedging flows – Market movements caused by trading and hedging in the options market. Hedging flows refer to large trades made to manage risk from options positions, which can influence underlying asset prices.
Exponential moving average (EMA) – A type of moving average that places more weight on recent prices, making it more responsive to new information compared to a simple moving average.
Resistance – A price level where an asset tends to stop rising due to selling interest. It often acts as a ceiling that prices struggle to break through.
VIX index – Also known as the “fear gauge,” the VIX measures expected volatility in the U.S. stock market over the next 30 days, derived from options prices.
Realized volatility – The actual observed volatility of a security over a specific past period, often calculated using historical price data.
Lower highs and lower lows – A bearish technical pattern in which each successive peak and trough in price is lower than the previous one, indicating a downtrend.
USDJPY – The currency pair representing the exchange rate between the U.S. dollar (USD) and the Japanese yen (JPY).
Test of support – A situation where an asset’s price approaches a level that historically prevents it from falling further (support level), and traders watch to see if it holds or breaks.
Tariff news – Updates or developments regarding tariffs (taxes on imports or exports), which can significantly impact markets by influencing trade dynamics and economic forecasts.
This report contains independent commentary to be used for informational and educational purposes only. Michael Kramer is a member and investment adviser representative with Mott Capital Management. Mr. Kramer is not affiliated with this company and does not serve on the board of any related company that issued this stock. All opinions and analyses presented by Michael Kramer in this analysis or market report are solely Michael Kramer’s views. Readers should not treat any opinion, viewpoint, or prediction expressed by Michael Kramer as a specific solicitation or recommendation to buy or sell a particular security or follow a particular strategy. Michael Kramer’s analyses are based upon information and independent research that he considers reliable, but neither Michael Kramer nor Mott Capital Management guarantees its completeness or accuracy, and it should not be relied upon as such. Michael Kramer is not under any obligation to update or correct any information presented in his analyses. Mr. Kramer’s statements, guidance, and opinions are subject to change without notice. Past performance is not indicative of future results. Neither Michael Kramer nor Mott Capital Management guarantees any specific outcome or profit. You should be aware of the real risk of loss in following any strategy or investment commentary presented in this analysis. Strategies or investments discussed may fluctuate in price or value. Investments or strategies mentioned in this analysis may not be suitable for you. This material does not consider your particular investment objectives, financial situation, or needs and is not intended as a recommendation appropriate for you. You must make an independent decision regarding investments or strategies in this analysis. Upon request, the advisor will provide a list of all recommendations made during the past twelve months. Before acting on information in this analysis, you should consider whether it is suitable for your circumstances and strongly consider seeking advice from your own financial or investment adviser to determine the suitability of any investment.


