


The Billionaire Cage Match No One Asked For

More Membership Content

It was an interesting day in the market, one that felt oddly reminiscent of the old MTV show Celebrity Deathmatch—except instead of claymation wrestling, we got a social media showdown between two billionaires airing their grievances in true Festivus fashion.
This time, it was Elon Musk and President Trump trading jabs—the ultimate battle of egos: the world’s richest man with no filter versus the world’s most powerful man, also with no filter. One can only imagine the “truths” and X-posts still to come.
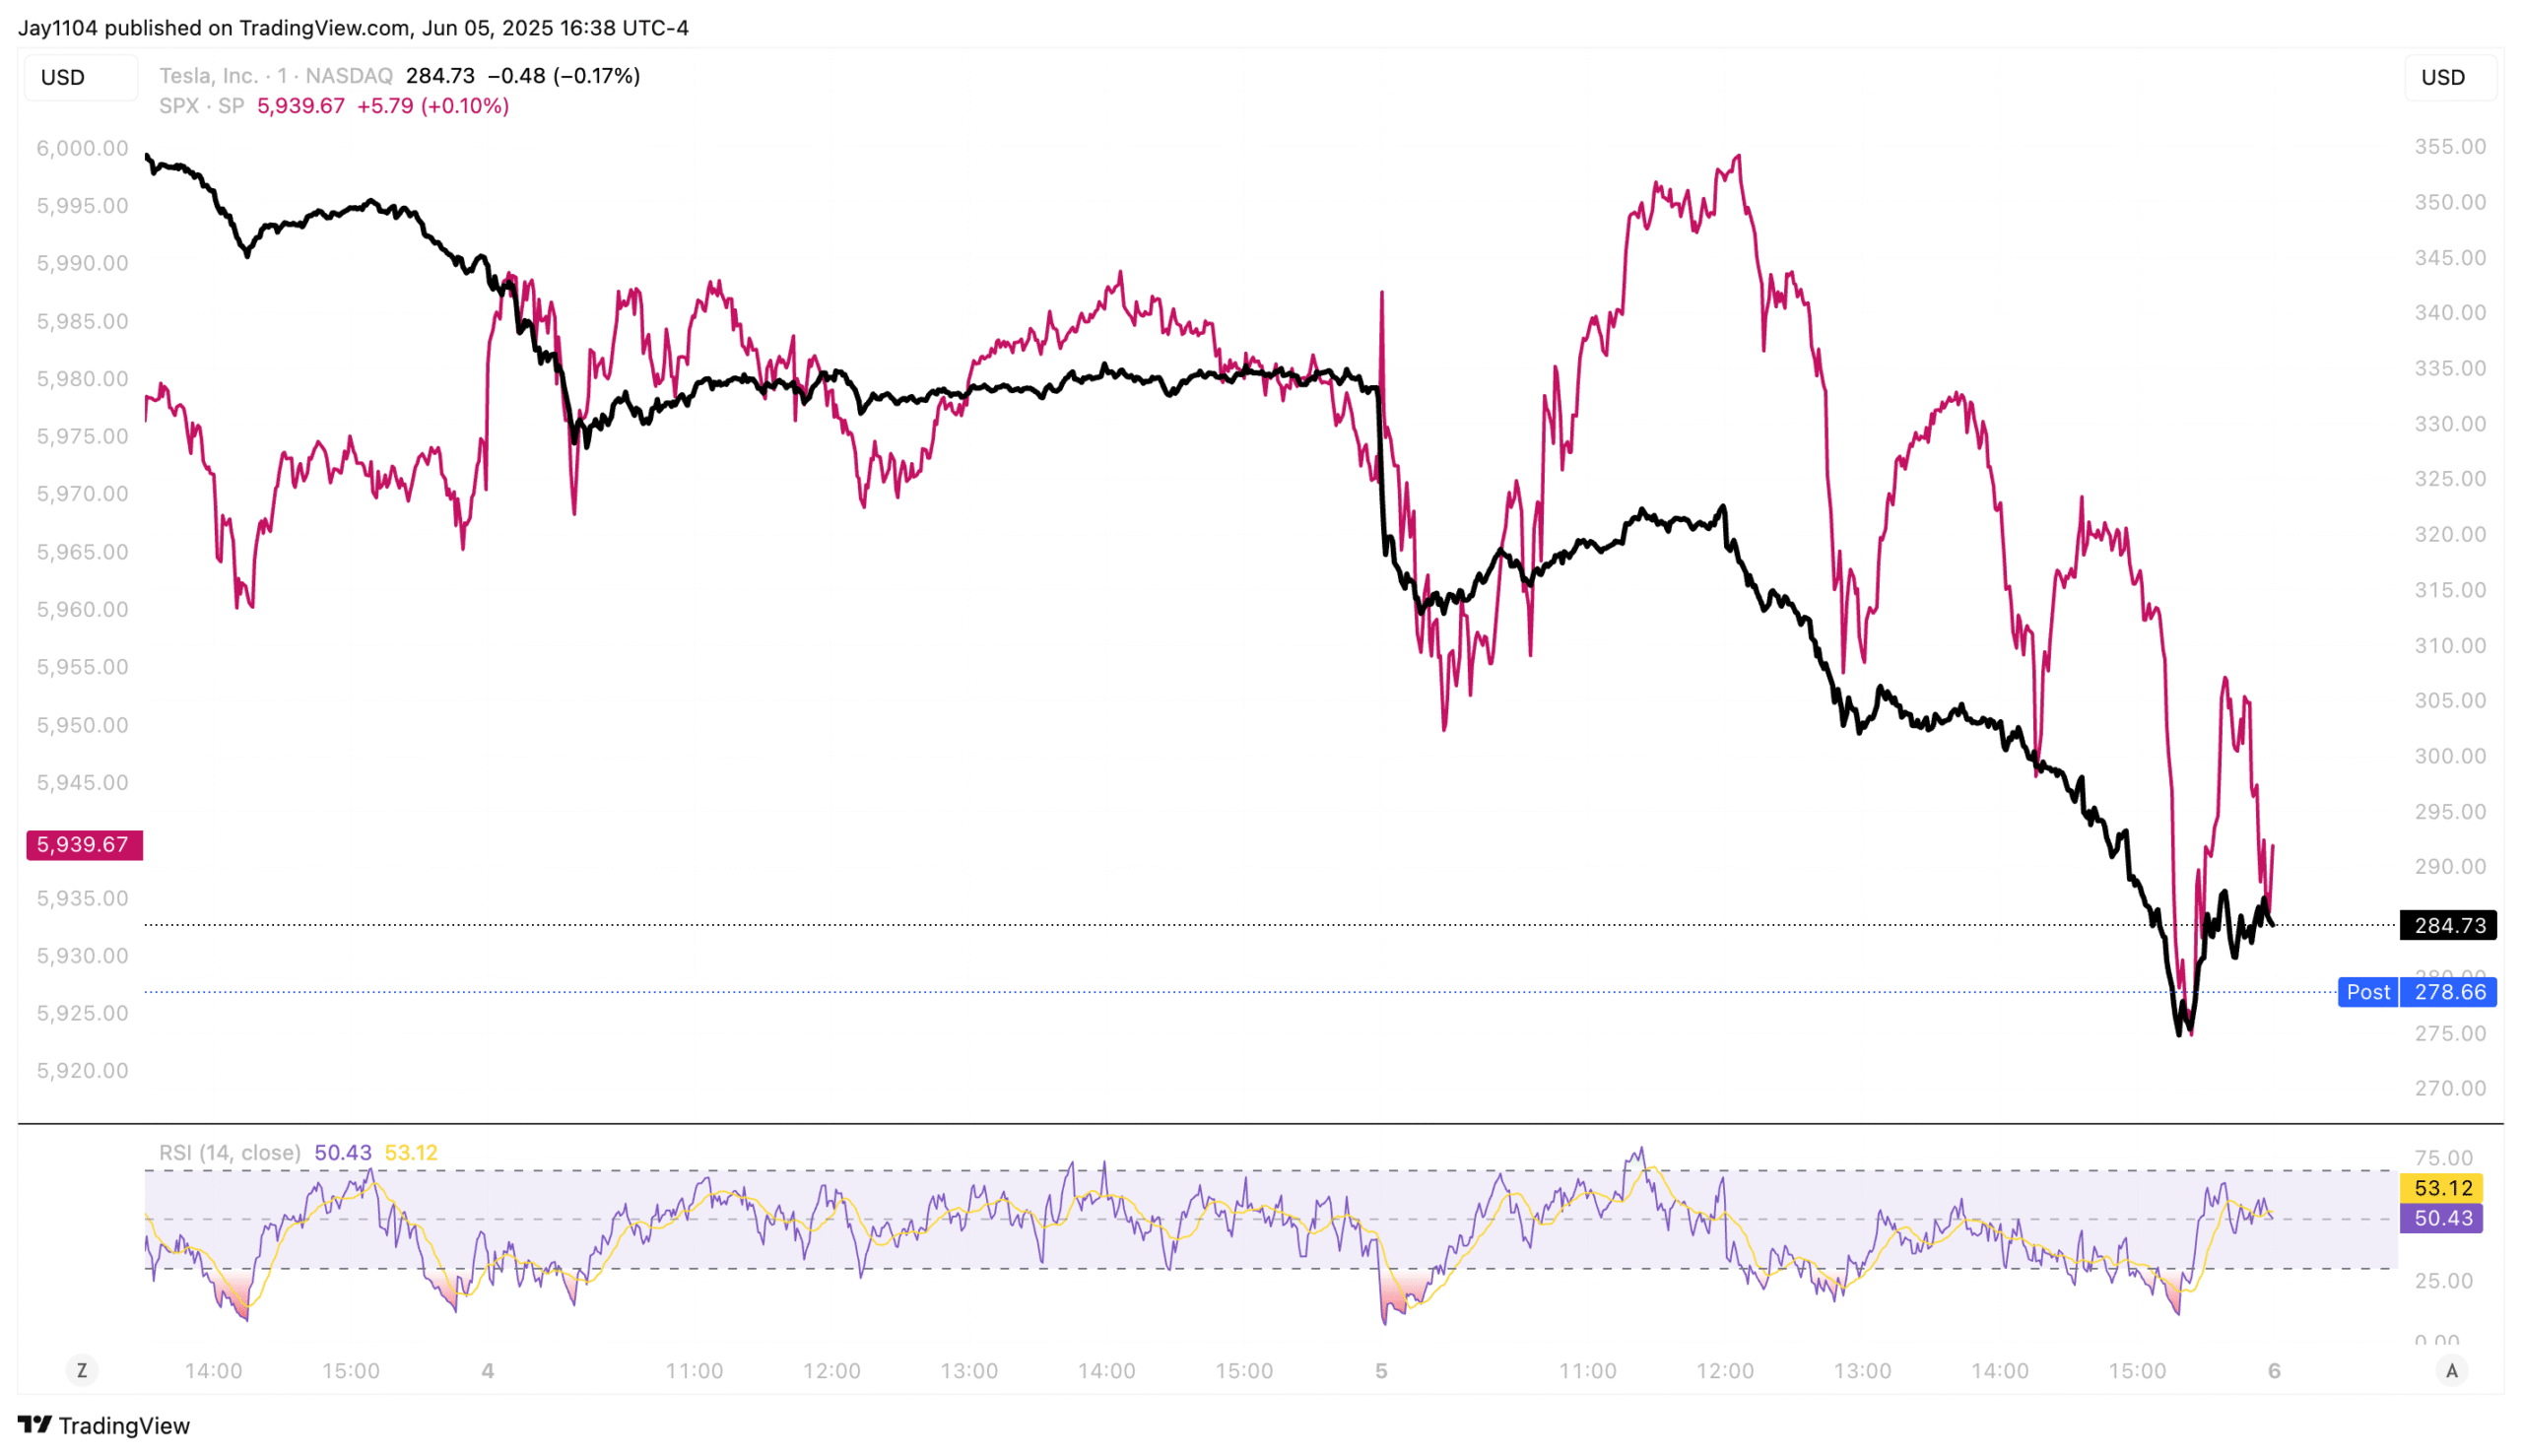
Tesla’s stock didn’t find the mudslinging amusing, dropping more than 14%. For much of the day, the S&P 500 moved in step with Tesla, though the broader market didn’t really feel the impact until around noon.
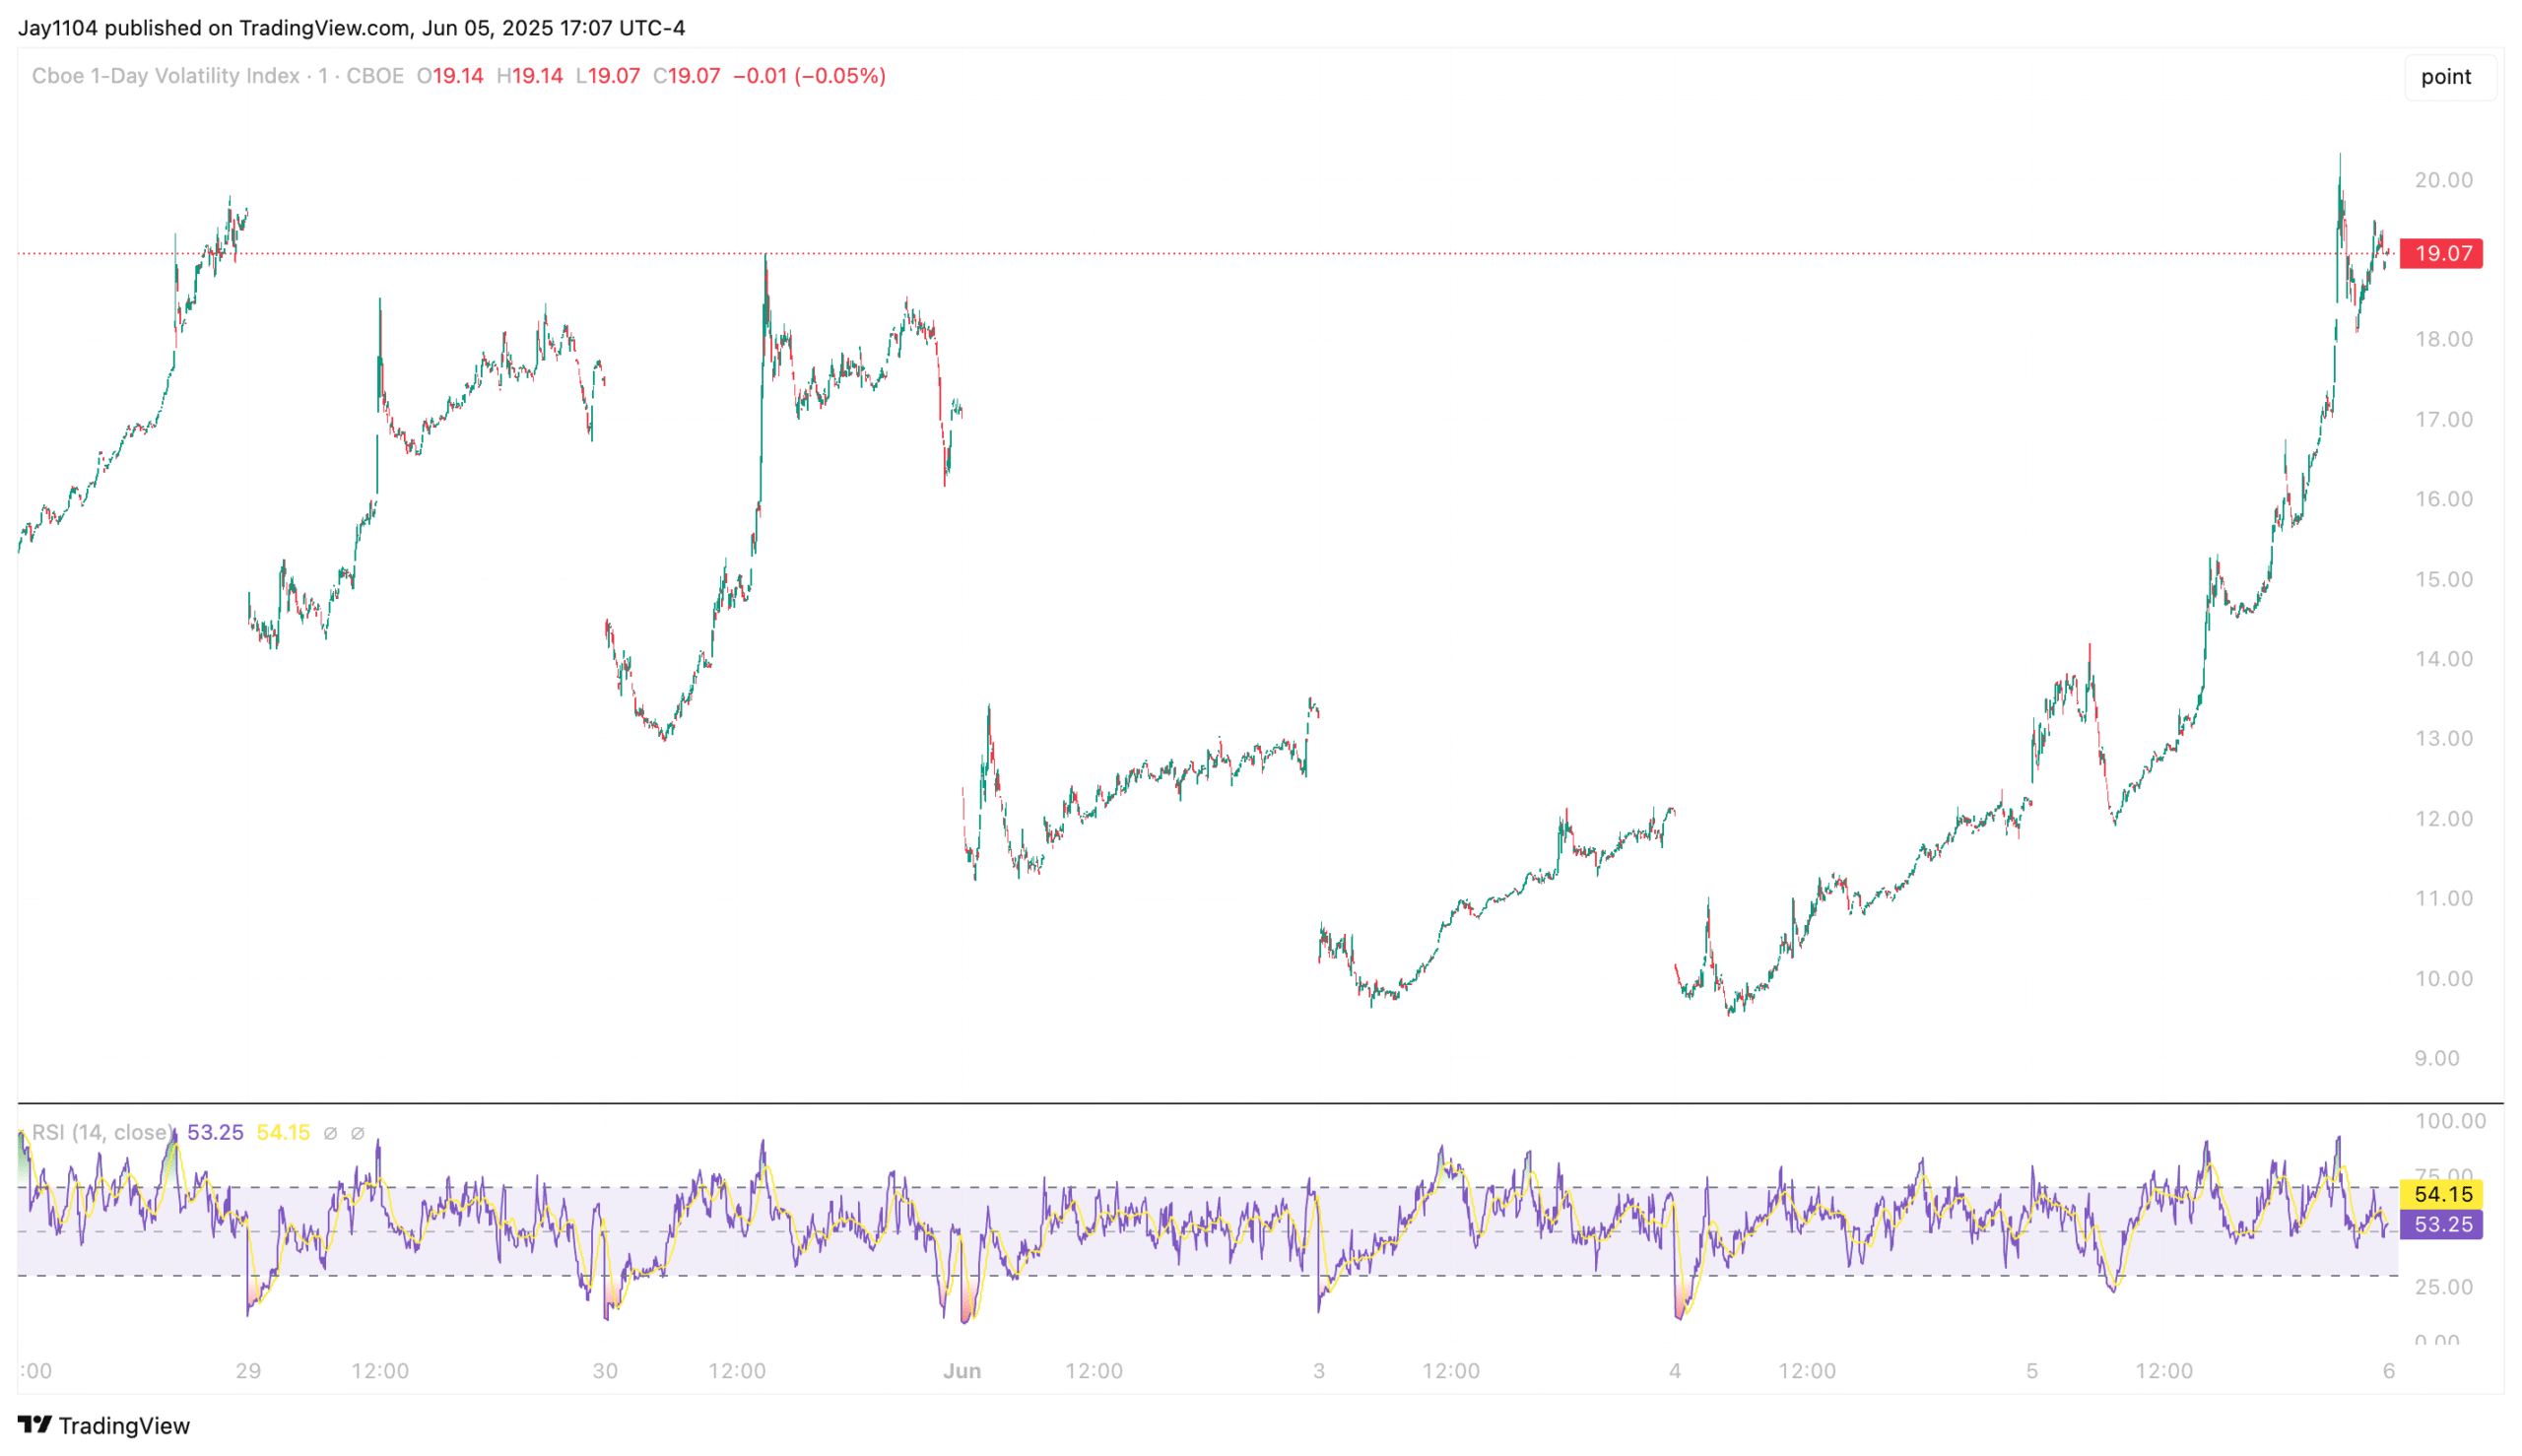
Anyway, with the jobs report coming tomorrow, implied volatility was bound to rise—whether or not Trump and Elon decided to feud. By the end of the day, the VIX 1-Day closed at 19, which feels more in line with where it should be ahead of an economic report as important as the jobs report.
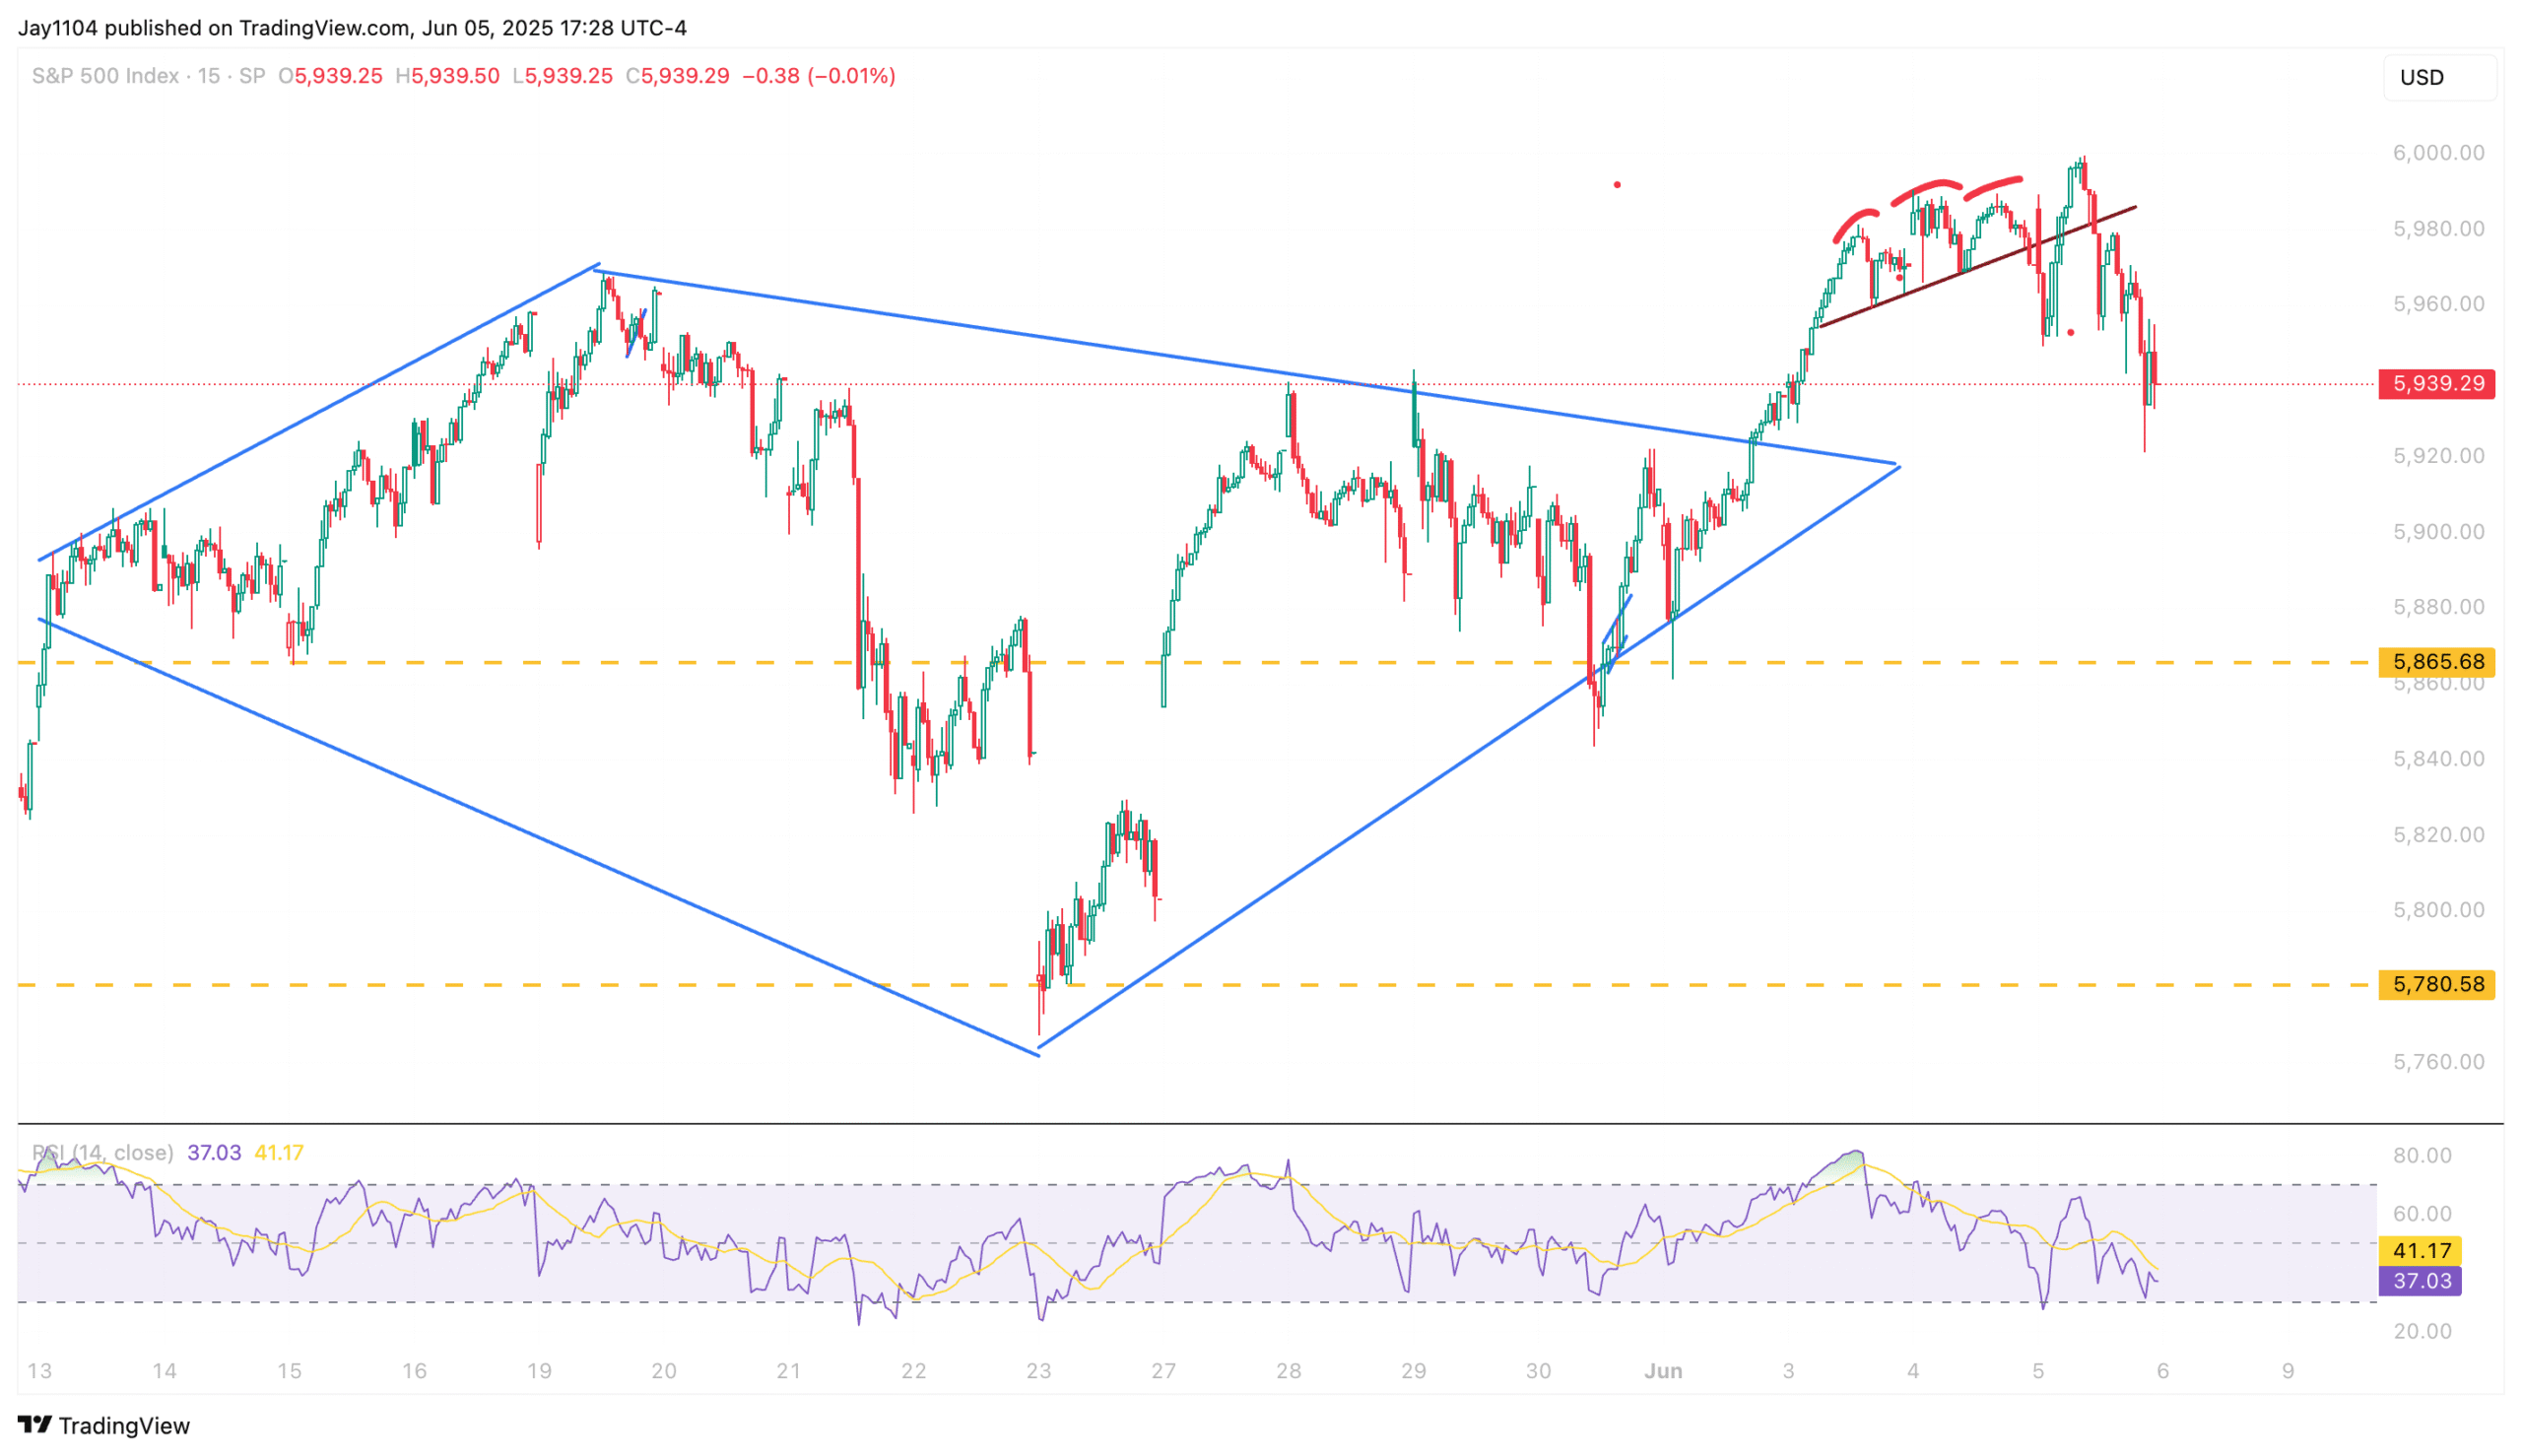
The S&P 500 fell about 50 basis points on the day, and the reversal formed a bearish engulfing candle on the chart.
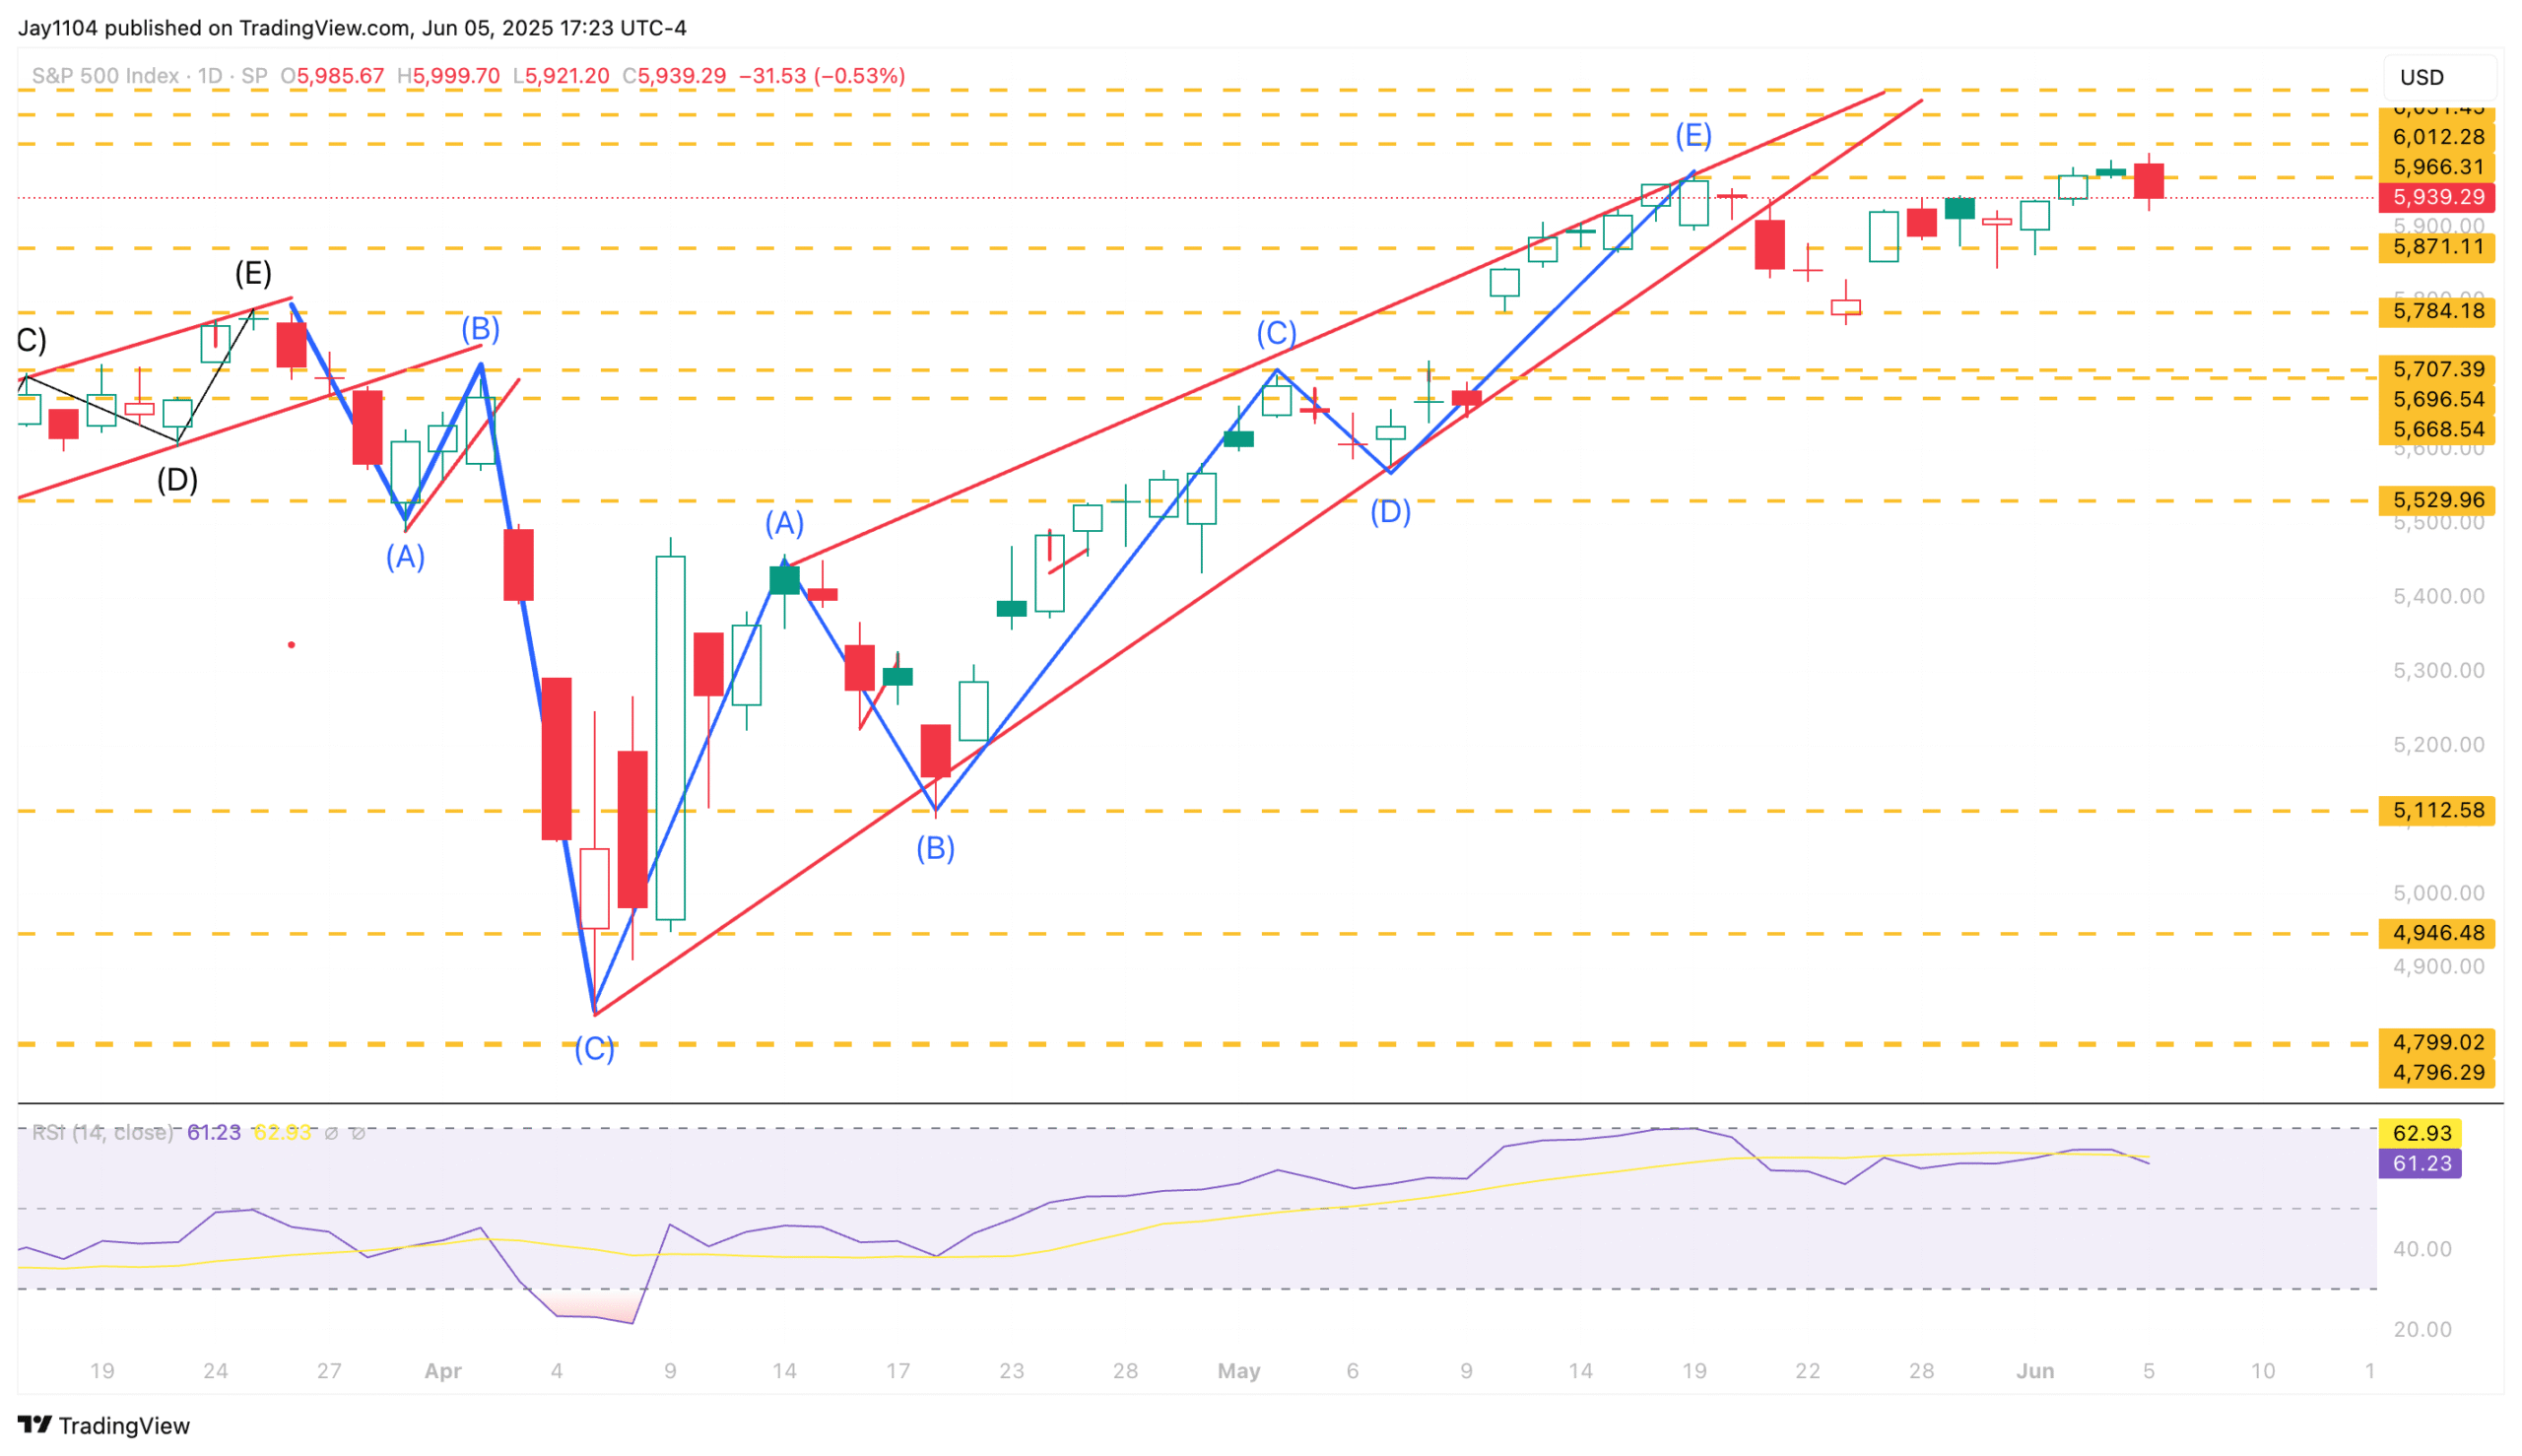
Additionally, those reversal patterns we talked about over the weekend—while they seemed all but dead—got a flicker of life from today’s decline. For those patterns to stay in play, the index really needs to drop below 5,910 tomorrow, which is only about 50 basis points lower than today’s close, or at least get close to it.
Otherwise, who knows what tomorrow will bring?
-Mike
1.
Reversal Patterns
Definition: Chart patterns that suggest a trend may be changing direction (e.g., from up to down).
Clarification: While an advanced investor knows what a reversal pattern is, specifying which (e.g., bearish engulfing, 2B top, head and shoulders) gives precision. Some may not immediately recognize less common ones like 2B tops.
2.
Bearish Engulfing Candle
Definition: A candlestick pattern where a large down candle completely “engulfs” the previous up candle, signaling potential trend reversal.
Clarification: Advanced investors in fundamentals may be less familiar with candlestick names if they don’t actively use technical analysis.
3.
VIX 1-Day
Definition: A short-term volatility index that measures expected volatility over a 1-day horizon, unlike the standard VIX, which is 30 days.
Clarification: Even advanced investors may not track the 1-Day VIX regularly, as it’s relatively new and less mainstream than the traditional VIX.
4.
Basis Points (bps)
Definition: One basis point = 0.01%, so 50 bps = 0.50%.
Clarification: Known to nearly all institutional investors, but still worth defining for clarity in retail or mixed audiences.
This report contains independent commentary to be used for informational and educational purposes only. Michael Kramer is a member and investment adviser representative with Mott Capital Management. Mr. Kramer is not affiliated with this company and does not serve on the board of any related company that issued this stock. All opinions and analyses presented by Michael Kramer in this analysis or market report are solely Michael Kramer’s views. Readers should not treat any opinion, viewpoint, or prediction expressed by Michael Kramer as a specific solicitation or recommendation to buy or sell a particular security or follow a particular strategy. Michael Kramer’s analyses are based upon information and independent research that he considers reliable, but neither Michael Kramer nor Mott Capital Management guarantees its completeness or accuracy, and it should not be relied upon as such. Michael Kramer is not under any obligation to update or correct any information presented in his analyses. Mr. Kramer’s statements, guidance, and opinions are subject to change without notice. Past performance is not indicative of future results. Neither Michael Kramer nor Mott Capital Management guarantees any specific outcome or profit. You should be aware of the real risk of loss in following any strategy or investment commentary presented in this analysis. Strategies or investments discussed may fluctuate in price or value. Investments or strategies mentioned in this analysis may not be suitable for you. This material does not consider your particular investment objectives, financial situation, or needs and is not intended as a recommendation appropriate for you. You must make an independent decision regarding investments or strategies in this analysis. Upon request, the advisor will provide a list of all recommendations made during the past twelve months. Before acting on information in this analysis, you should consider whether it is suitable for your circumstances and strongly consider seeking advice from your own financial or investment adviser to determine the suitability of any investment.
All right! Trader Vic 2B is back!!!