


The VIX Pinning Effects May Soon Be Behind Us

Recent member Titles:


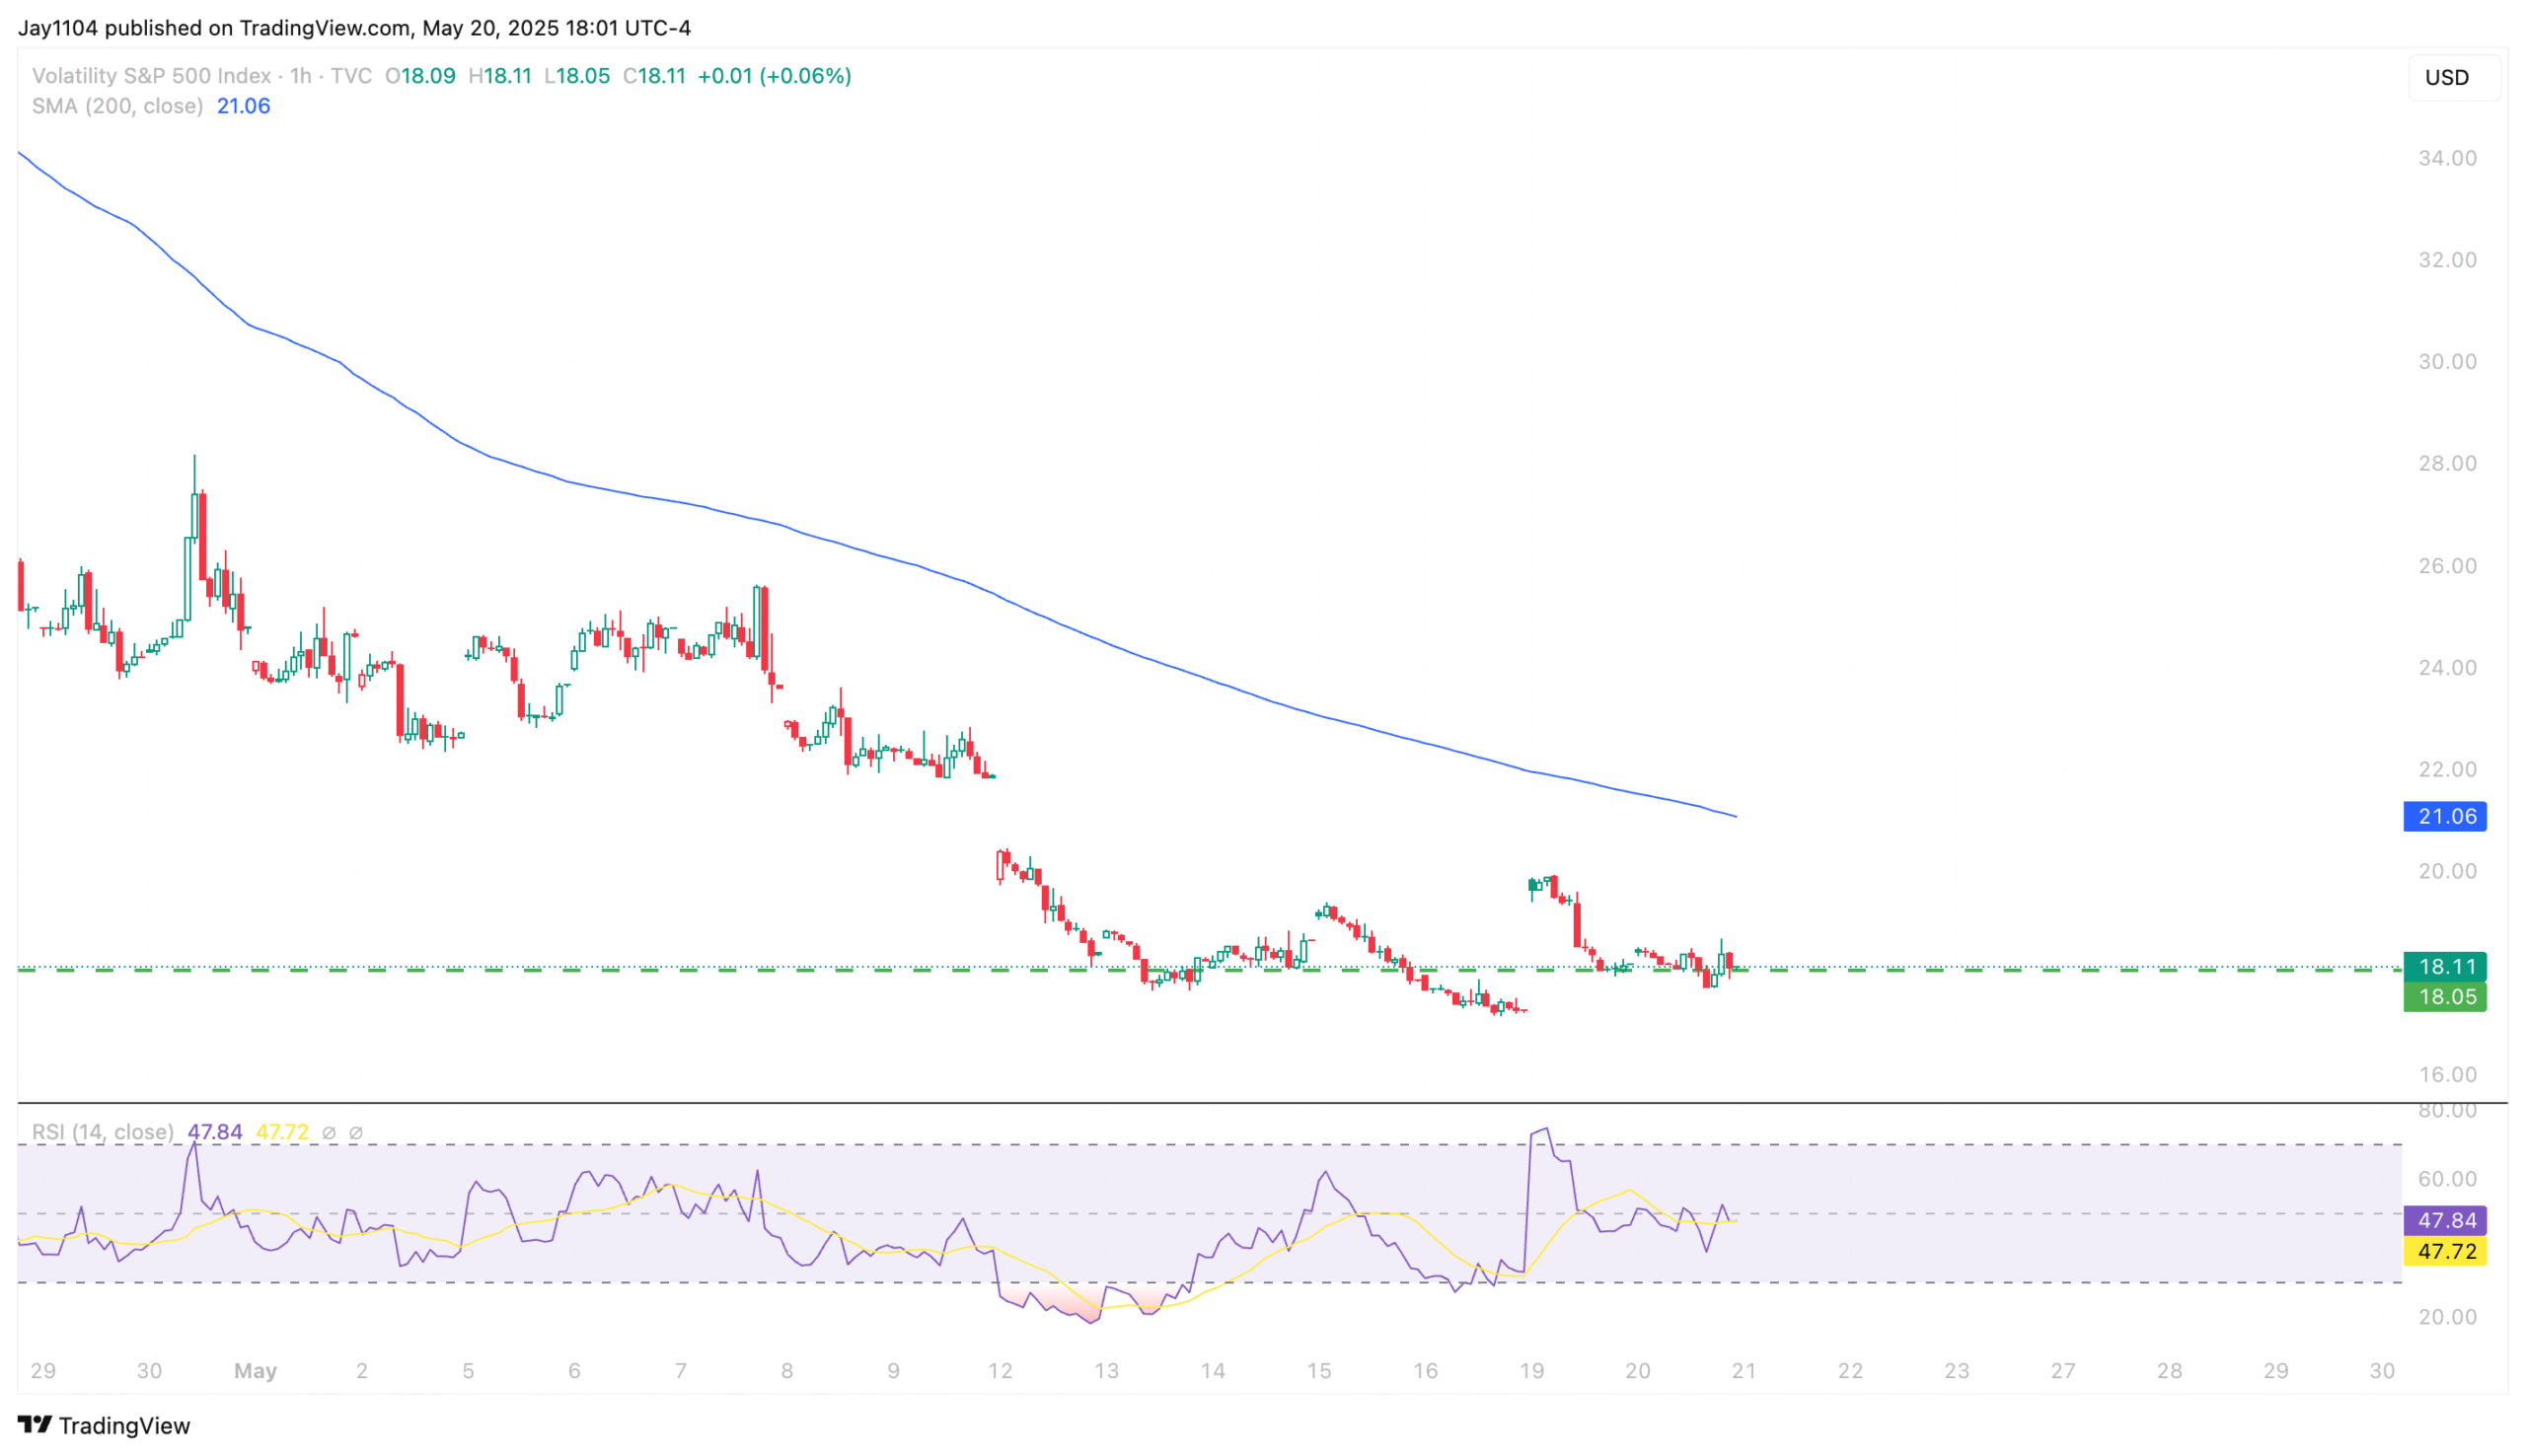
The S&P 500 finished the day lower, falling by around 40 bps. It looked like the market did its best to keep the VIX from going below 18 today. Tomorrow morning will be the VIX opex, and that will be that, and the pin at 18 will be no more. The VIX has been mean-reverting to 18 every day since getting there last Monday.
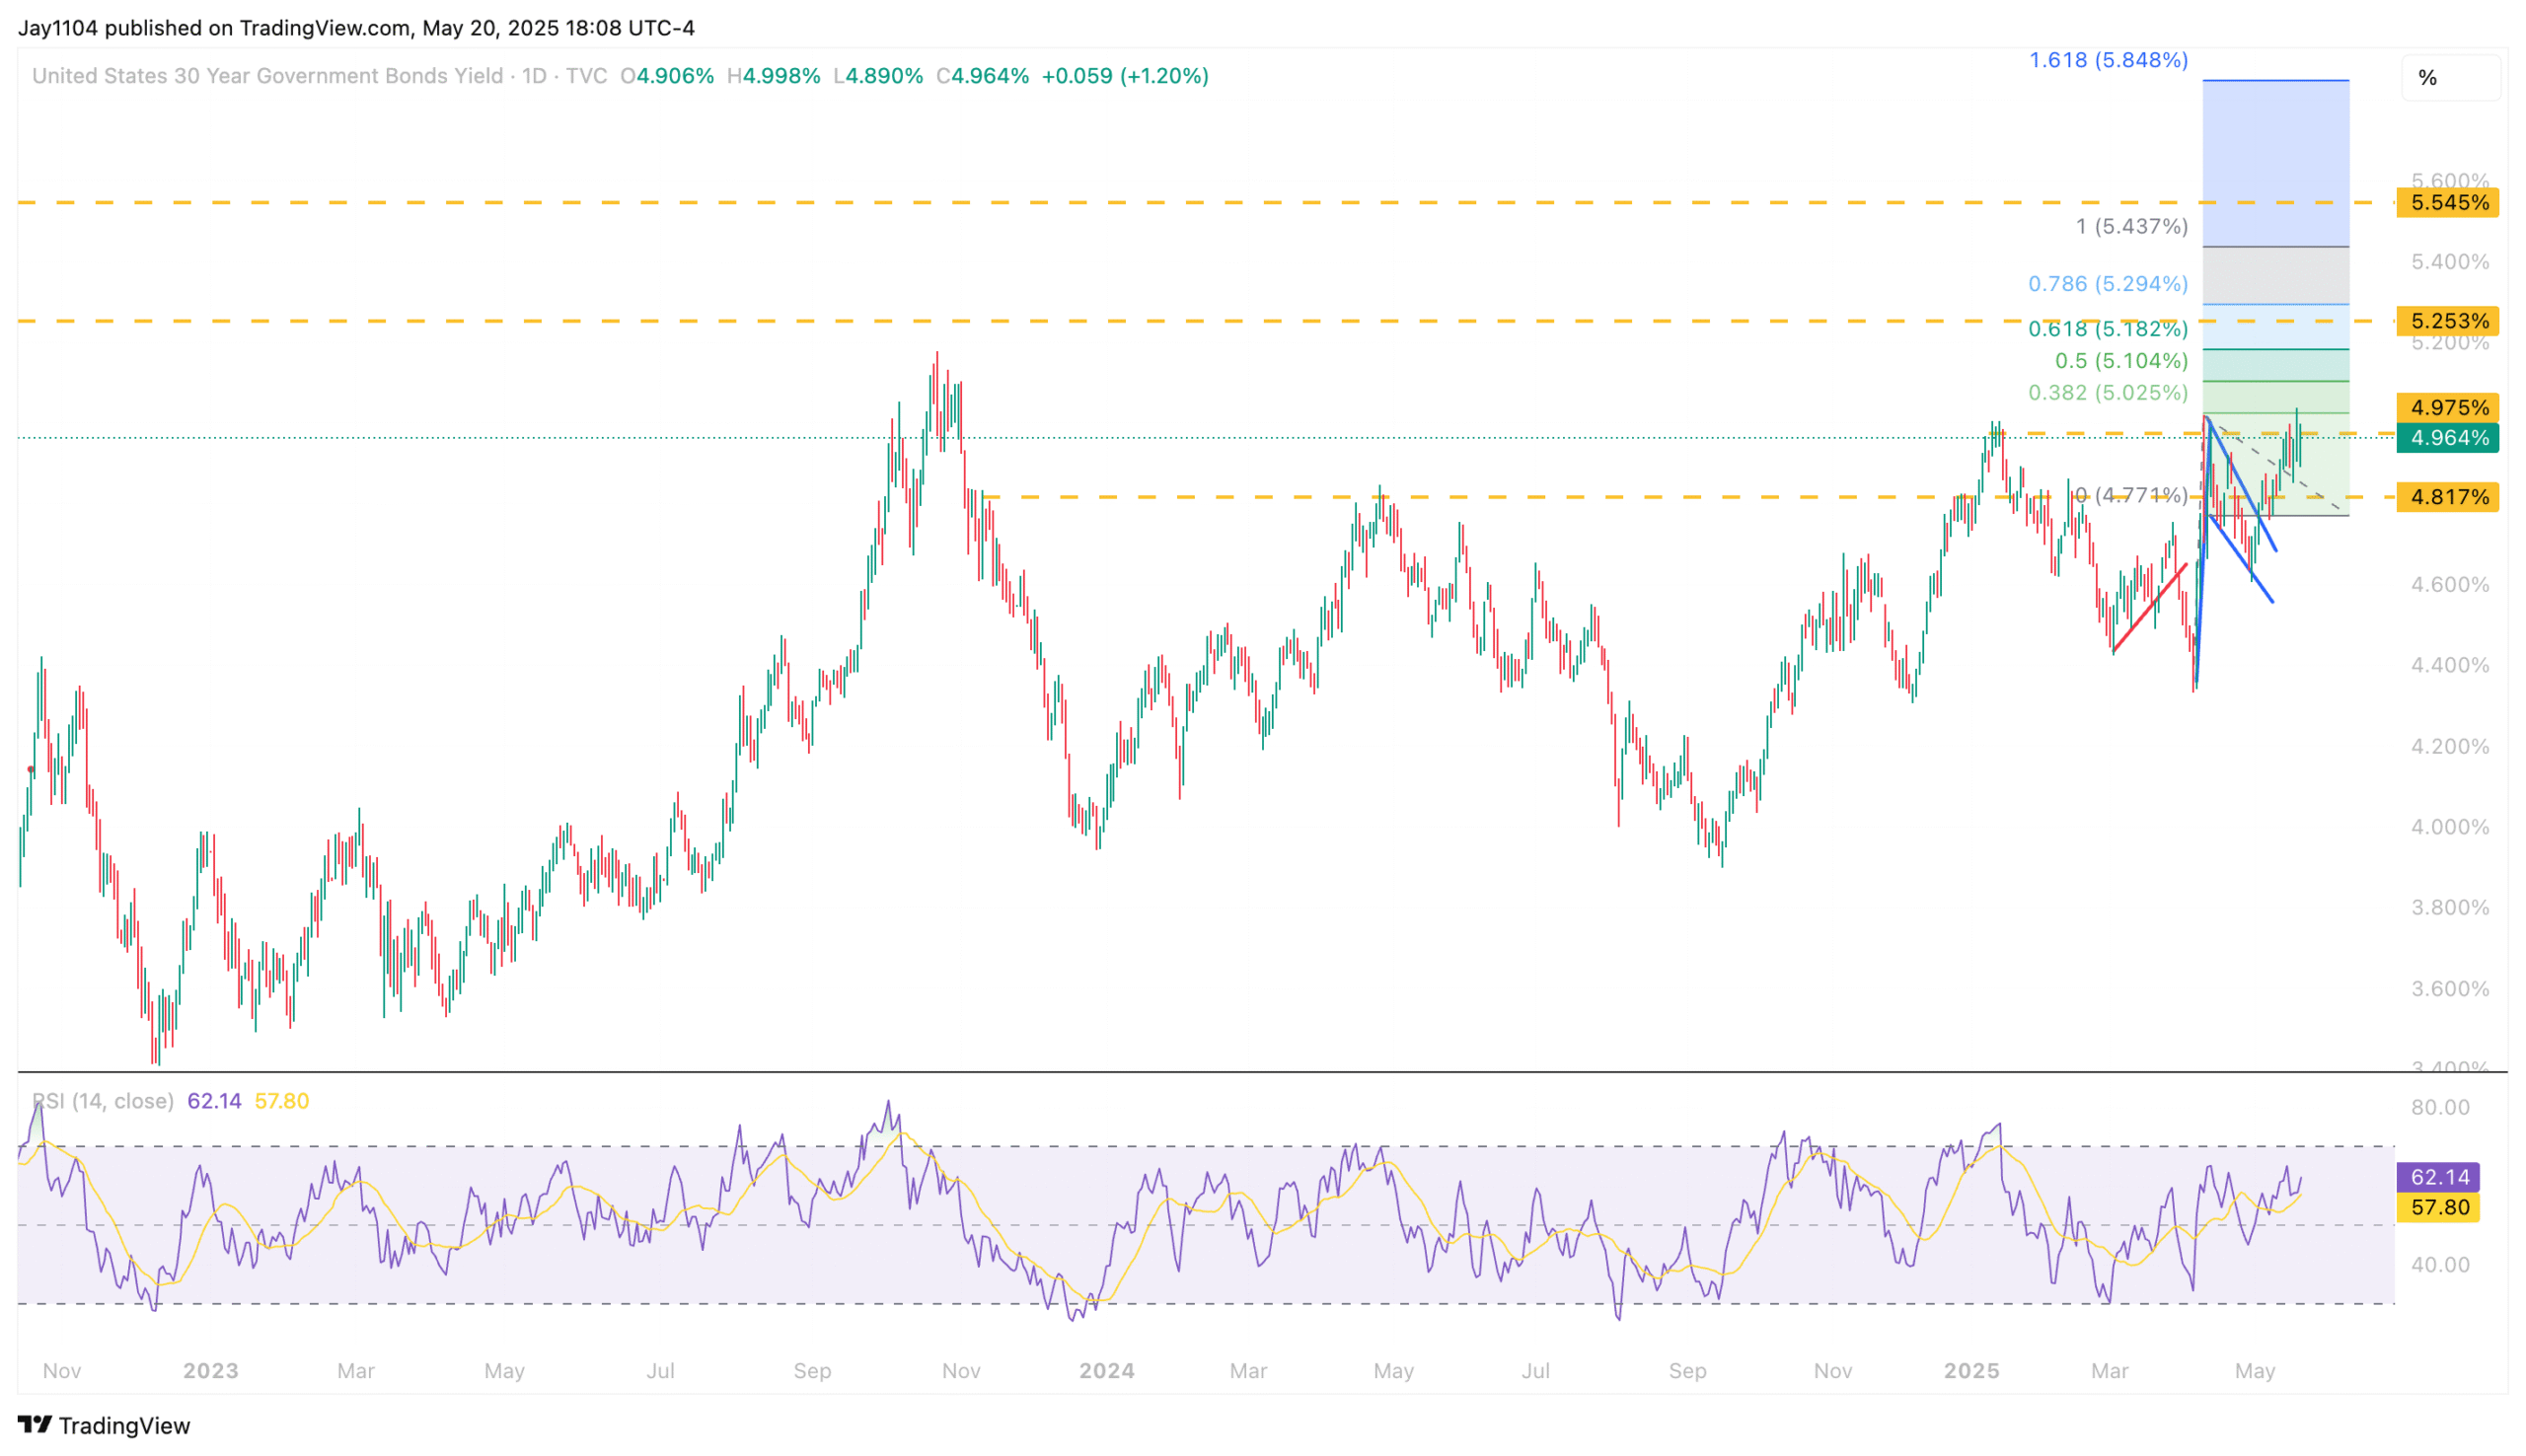
In the meantime, the 30-year Treasury rose by six bps to 4.97%. The big question is whether we are going to finally crack 5% and really make a meaningful move higher. Technically speaking, I could make a strong argument for a 30-year Treasury between 5.25% and 5.5%. Fundamentally, I could make a strong argument for rates being much higher than that.
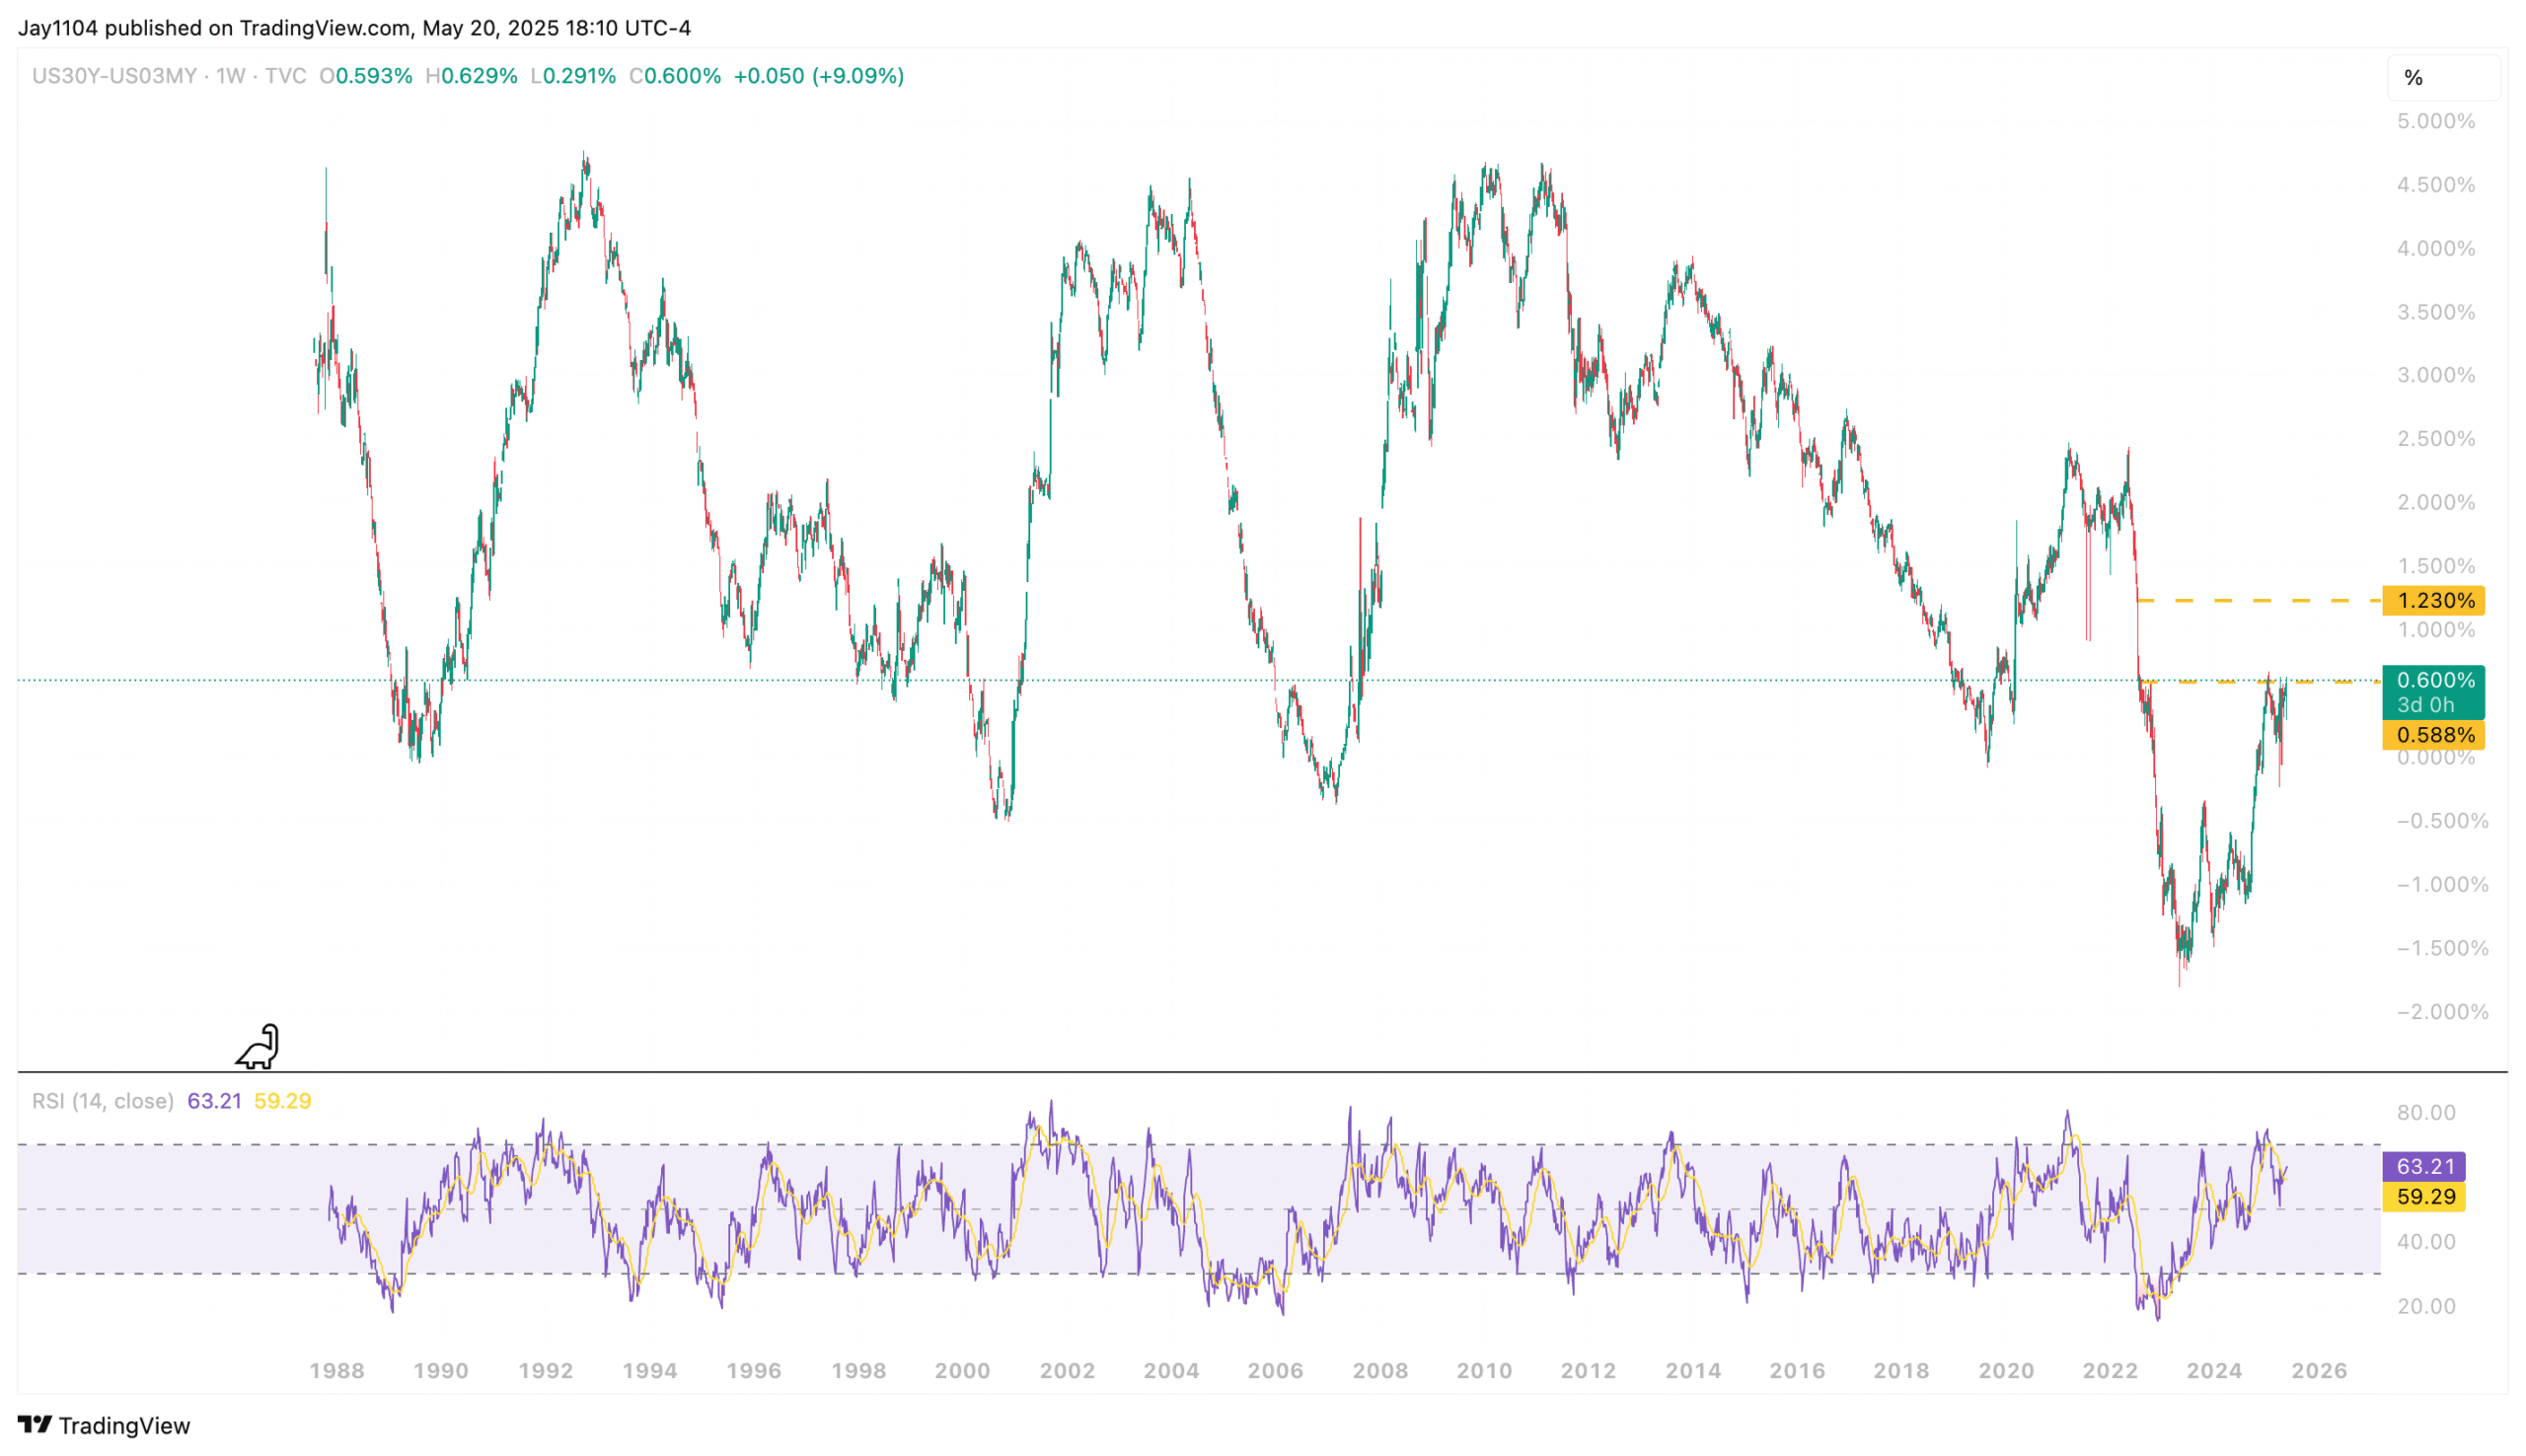
The 30-year minus the 3-month rose to 60 bps today, and if we break through the level of resistance, the 30-year rate could go much higher because there is not much resistance. The question ultimately is how wide this spread gets. If the economy doesn't head to recession, and the 3-month settles around 3%, the 30-year rate could be much higher over time. Since 1988, the 30-year typically tops out around 4.5% higher than the 3-month rate. You can do the math.
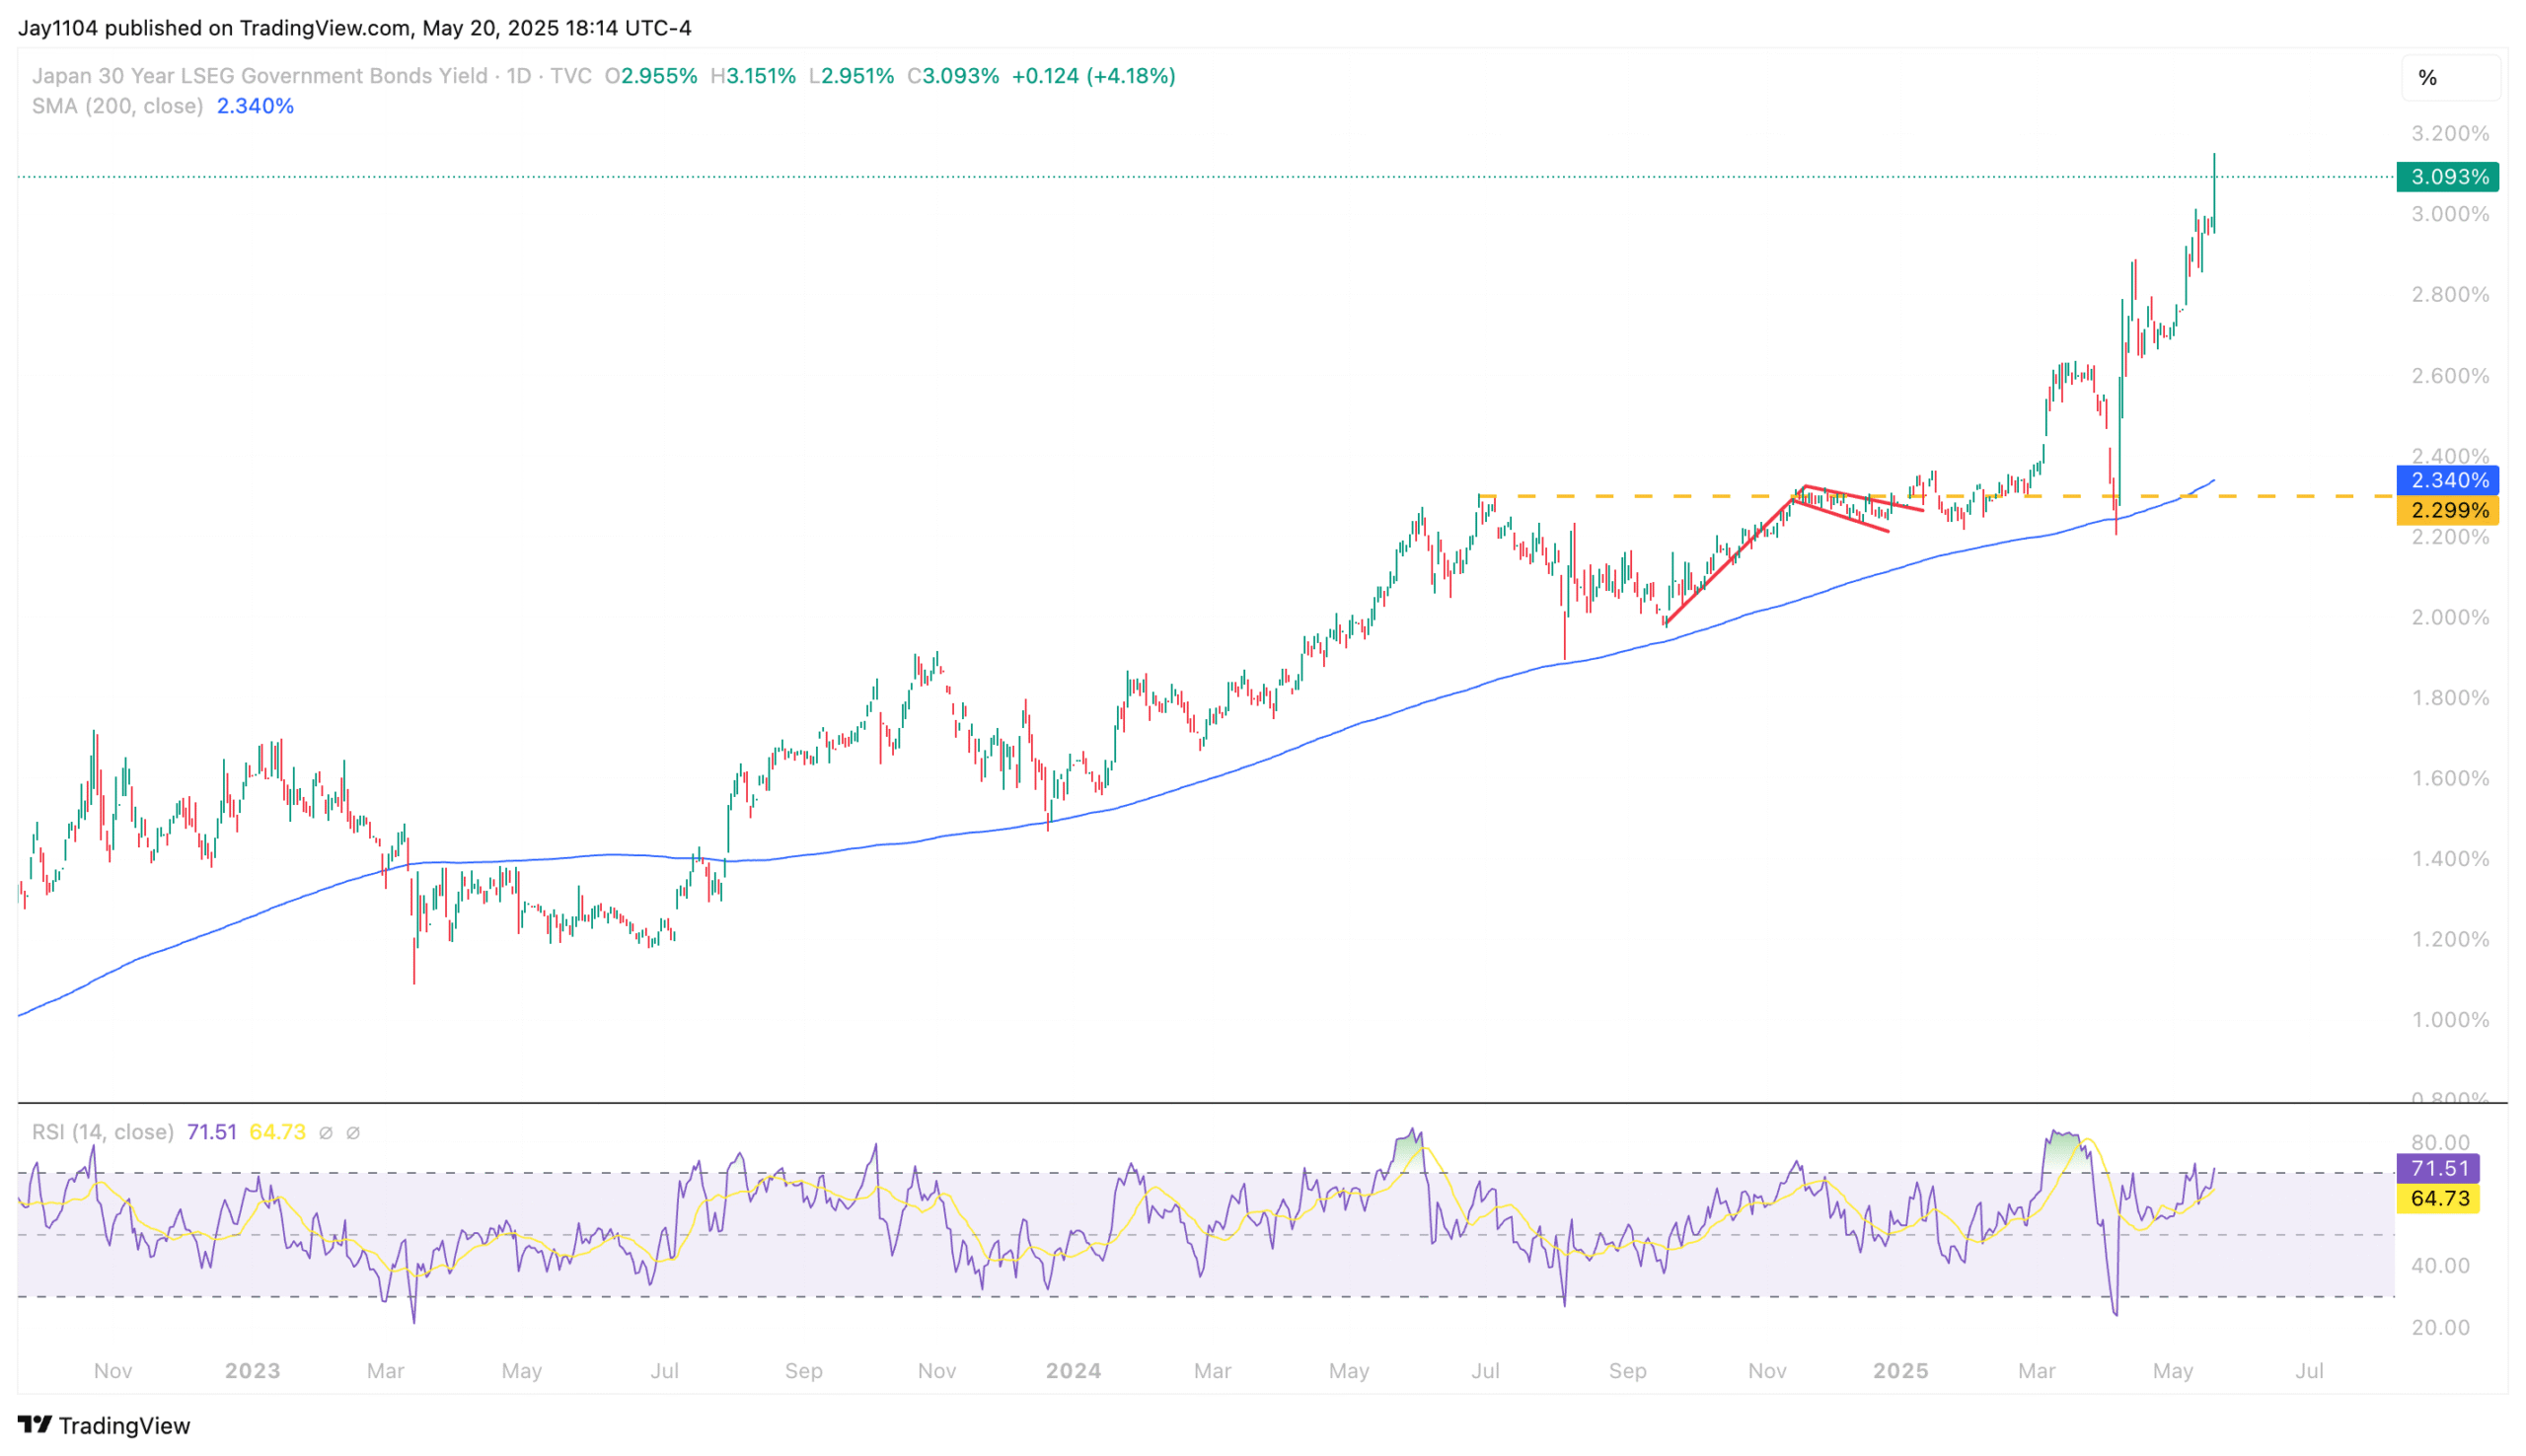
It will be interesting to see how and if the BOJ responds to the rapid rise in long-end rates in Japan, with the 30-year JGB rising by 12 bps yesterday to 3.09%.
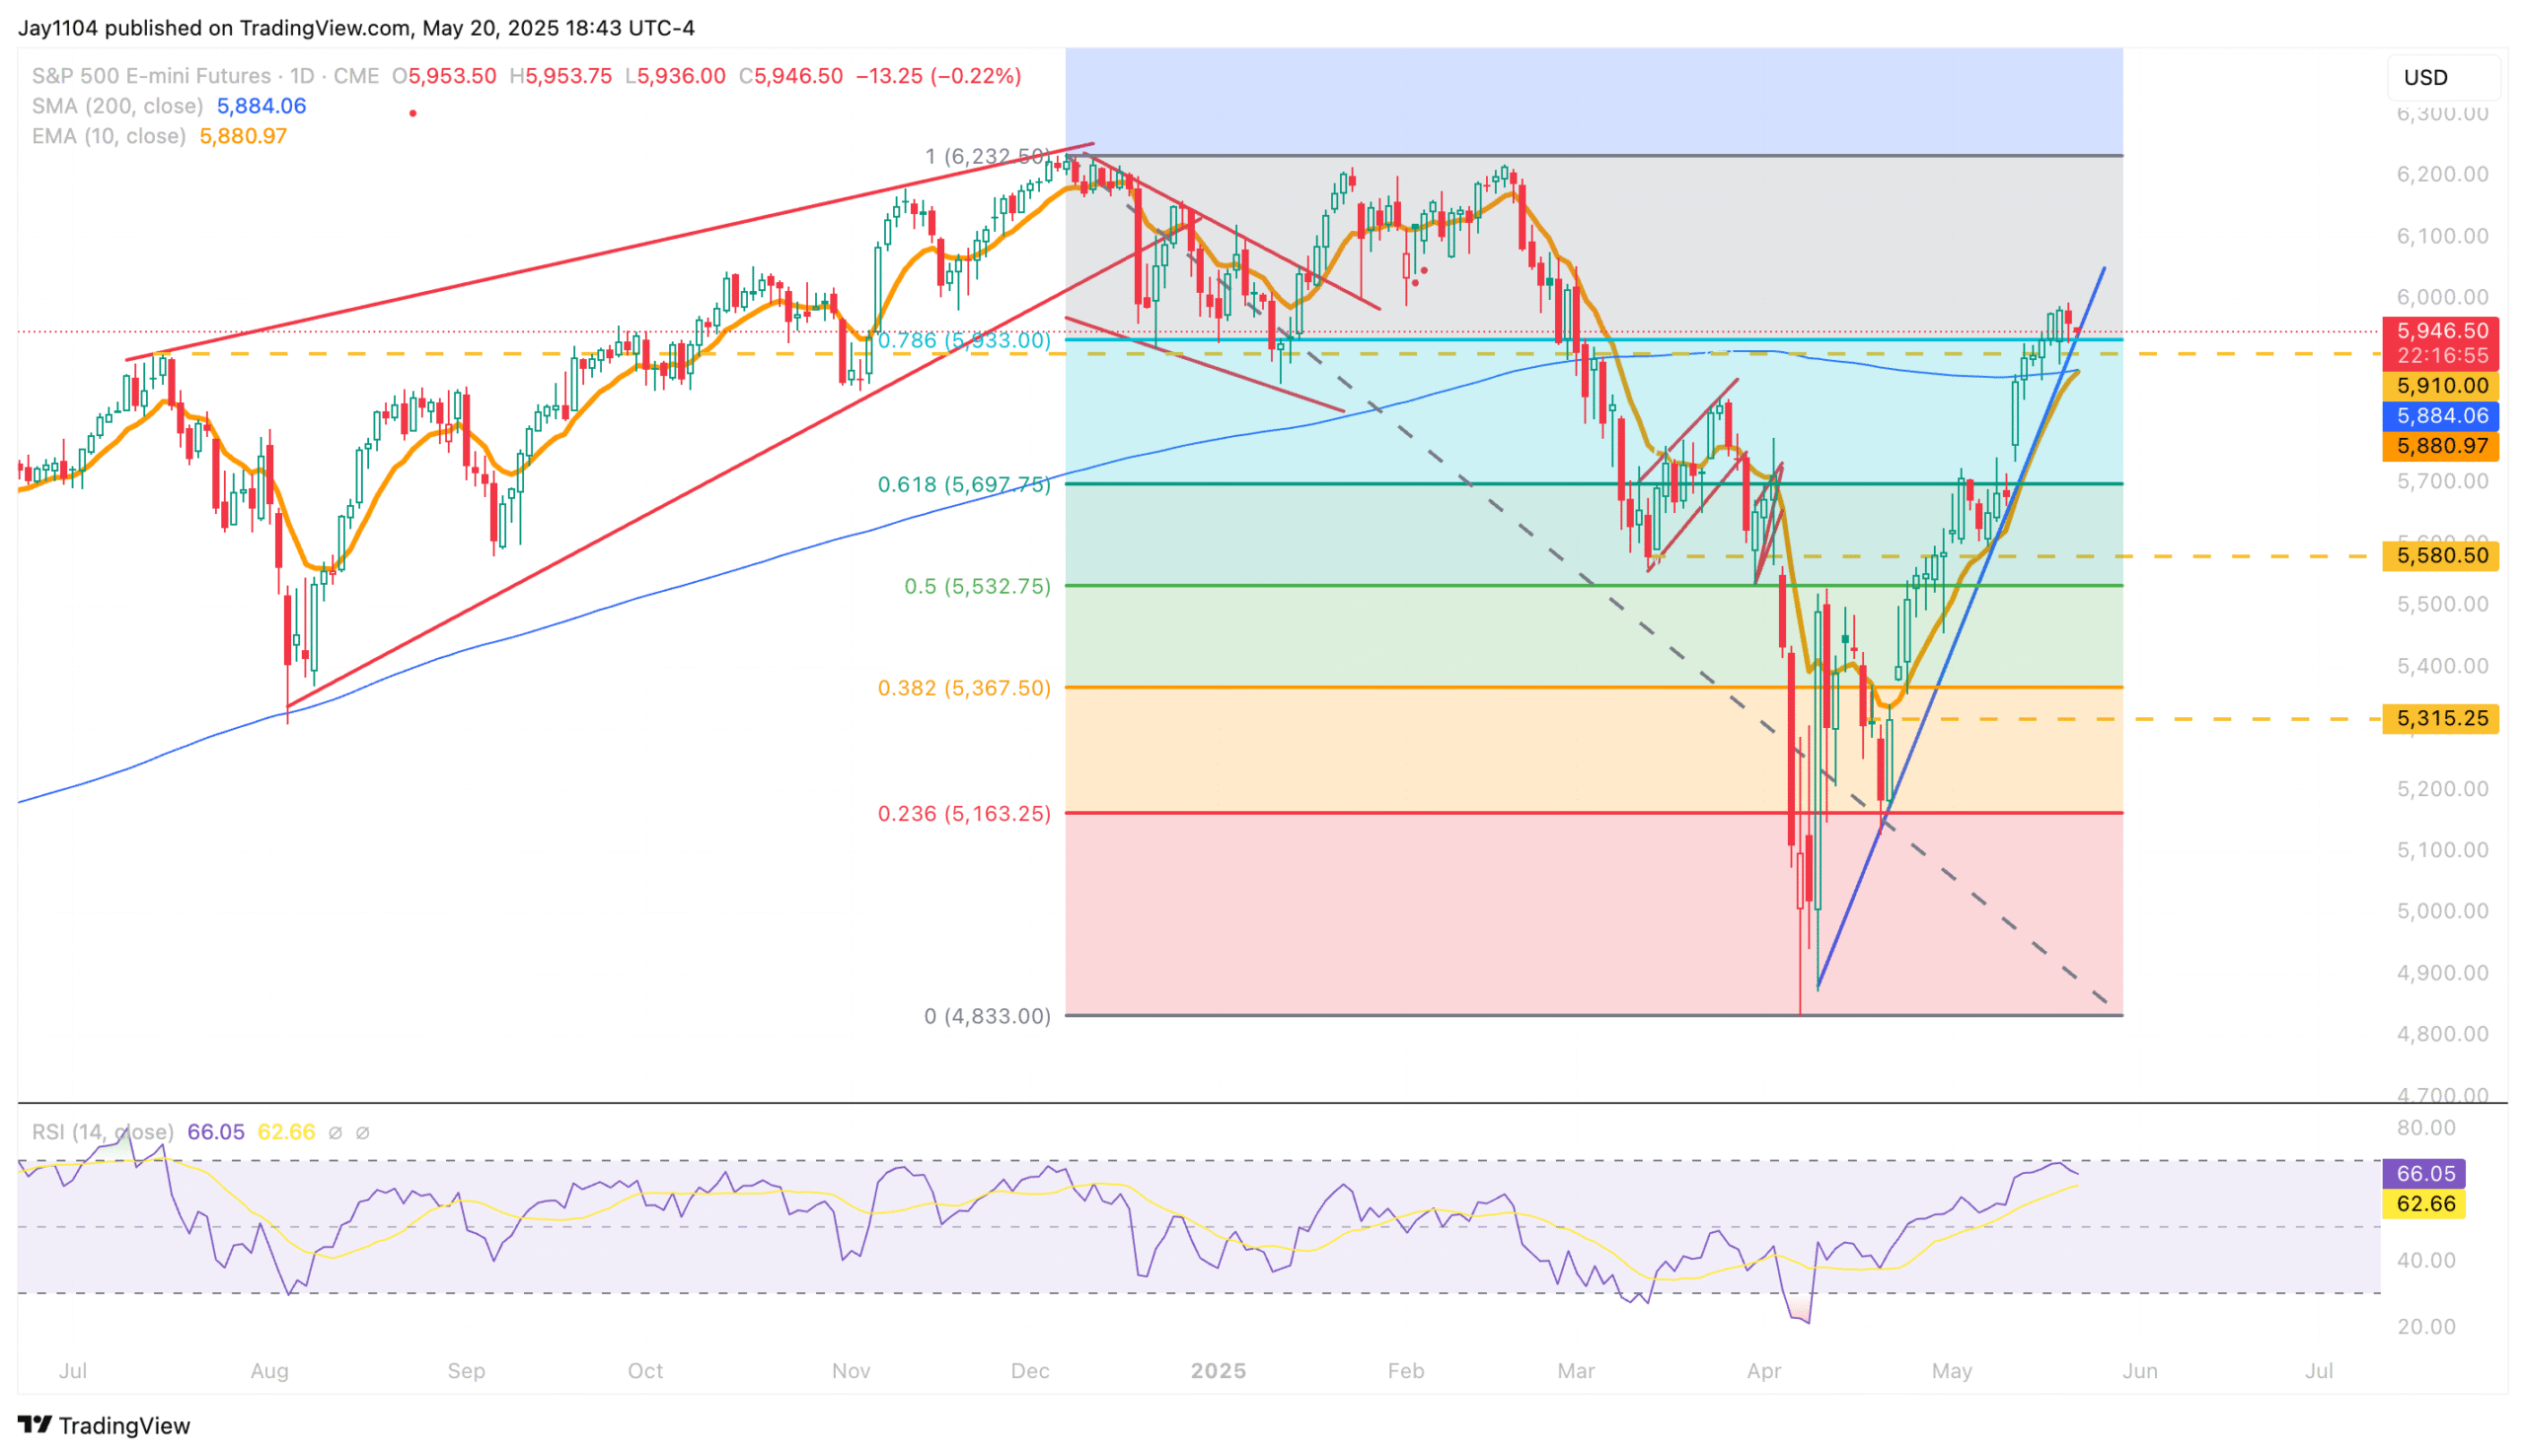
Finally, we have the 10-day EMA, the 200-day SMA, technical support at 5,900, the 78.6 retracement level, along with an uptrend in the S&P 500 futures, all in play here. I'd imagine that if this 5,900 level break were to occur, we could see that gap fill on the ES at 5,685 within a few days.
More tomorrow...
-Mike
Terms By ChatGPT
bps (basis points):
A common unit for measuring interest rates and yields; 1 basis point = 0.01%.
OPEX (Options Expiration):
The date on which an options contract expires, often resulting in increased market volatility or trading activity.
Pin:
A phenomenon where prices tend to close near the strike prices of heavily traded options contracts at expiration, creating temporary price stability or equilibrium.
Mean-reverting:
A statistical term referring to a tendency for a financial variable, such as volatility or price, to return to its long-term average after deviating from it.
30-year Treasury:
A U.S. government debt security with a maturity of 30 years, often used as a benchmark for long-term interest rates.
Resistance:
A technical analysis term referring to a price level at which selling pressure typically prevents an asset from rising further.
Spread (30-year minus 3-month):
The yield difference between long-term (30-year Treasury) and short-term (3-month Treasury) interest rates. This spread is often used as an indicator of economic health or recession risks.
Retracement level (78.6%):
A Fibonacci retracement level, commonly used in technical analysis, indicating a possible reversal or support/resistance level after significant price movements.
10-day EMA (Exponential Moving Average):
A technical indicator showing the average price of an asset over the last 10 days, placing more weight on recent prices.
200-day SMA (Simple Moving Average):
A widely-used technical indicator that averages the closing price over the past 200 days, often indicating long-term trend direction.
Gap fill:
Occurs when a stock or futures price moves back to a previous day’s closing price, filling a gap that appeared on the chart due to overnight price movements.
ES (E-mini S&P 500 futures):
A futures contract that tracks the S&P 500 index, frequently used by traders to speculate on or hedge equity market risk.
BOJ (Bank of Japan):
Japan’s central bank responsible for monetary policy, including interest rate decisions and market interventions.
JGB (Japanese Government Bond):
Debt securities issued by the government of Japan, analogous to U.S. Treasuries.
This report contains independent commentary to be used for informational and educational purposes only. Michael Kramer is a member and investment adviser representative with Mott Capital Management. Mr. Kramer is not affiliated with this company and does not serve on the board of any related company that issued this stock. All opinions and analyses presented by Michael Kramer in this analysis or market report are solely Michael Kramer’s views. Readers should not treat any opinion, viewpoint, or prediction expressed by Michael Kramer as a specific solicitation or recommendation to buy or sell a particular security or follow a particular strategy. Michael Kramer’s analyses are based upon information and independent research that he considers reliable, but neither Michael Kramer nor Mott Capital Management guarantees its completeness or accuracy, and it should not be relied upon as such. Michael Kramer is not under any obligation to update or correct any information presented in his analyses. Mr. Kramer’s statements, guidance, and opinions are subject to change without notice. Past performance is not indicative of future results. Neither Michael Kramer nor Mott Capital Management guarantees any specific outcome or profit. You should be aware of the real risk of loss in following any strategy or investment commentary presented in this analysis. Strategies or investments discussed may fluctuate in price or value. Investments or strategies mentioned in this analysis may not be suitable for you. This material does not consider your particular investment objectives, financial situation, or needs and is not intended as a recommendation appropriate for you. You must make an independent decision regarding investments or strategies in this analysis. Upon request, the advisor will provide a list of all recommendations made during the past twelve months. Before acting on information in this analysis, you should consider whether it is suitable for your circumstances and strongly consider seeking advice from your own financial or investment adviser to determine the suitability of any investment.